
Plots of yearly average temperatures in 10 cities, along with how 2018 ranked.
Jump to:
- Adelaide
- Sydney City
- Richmond (Western Sydney)
- Canberra
- Perth
- Brisbane
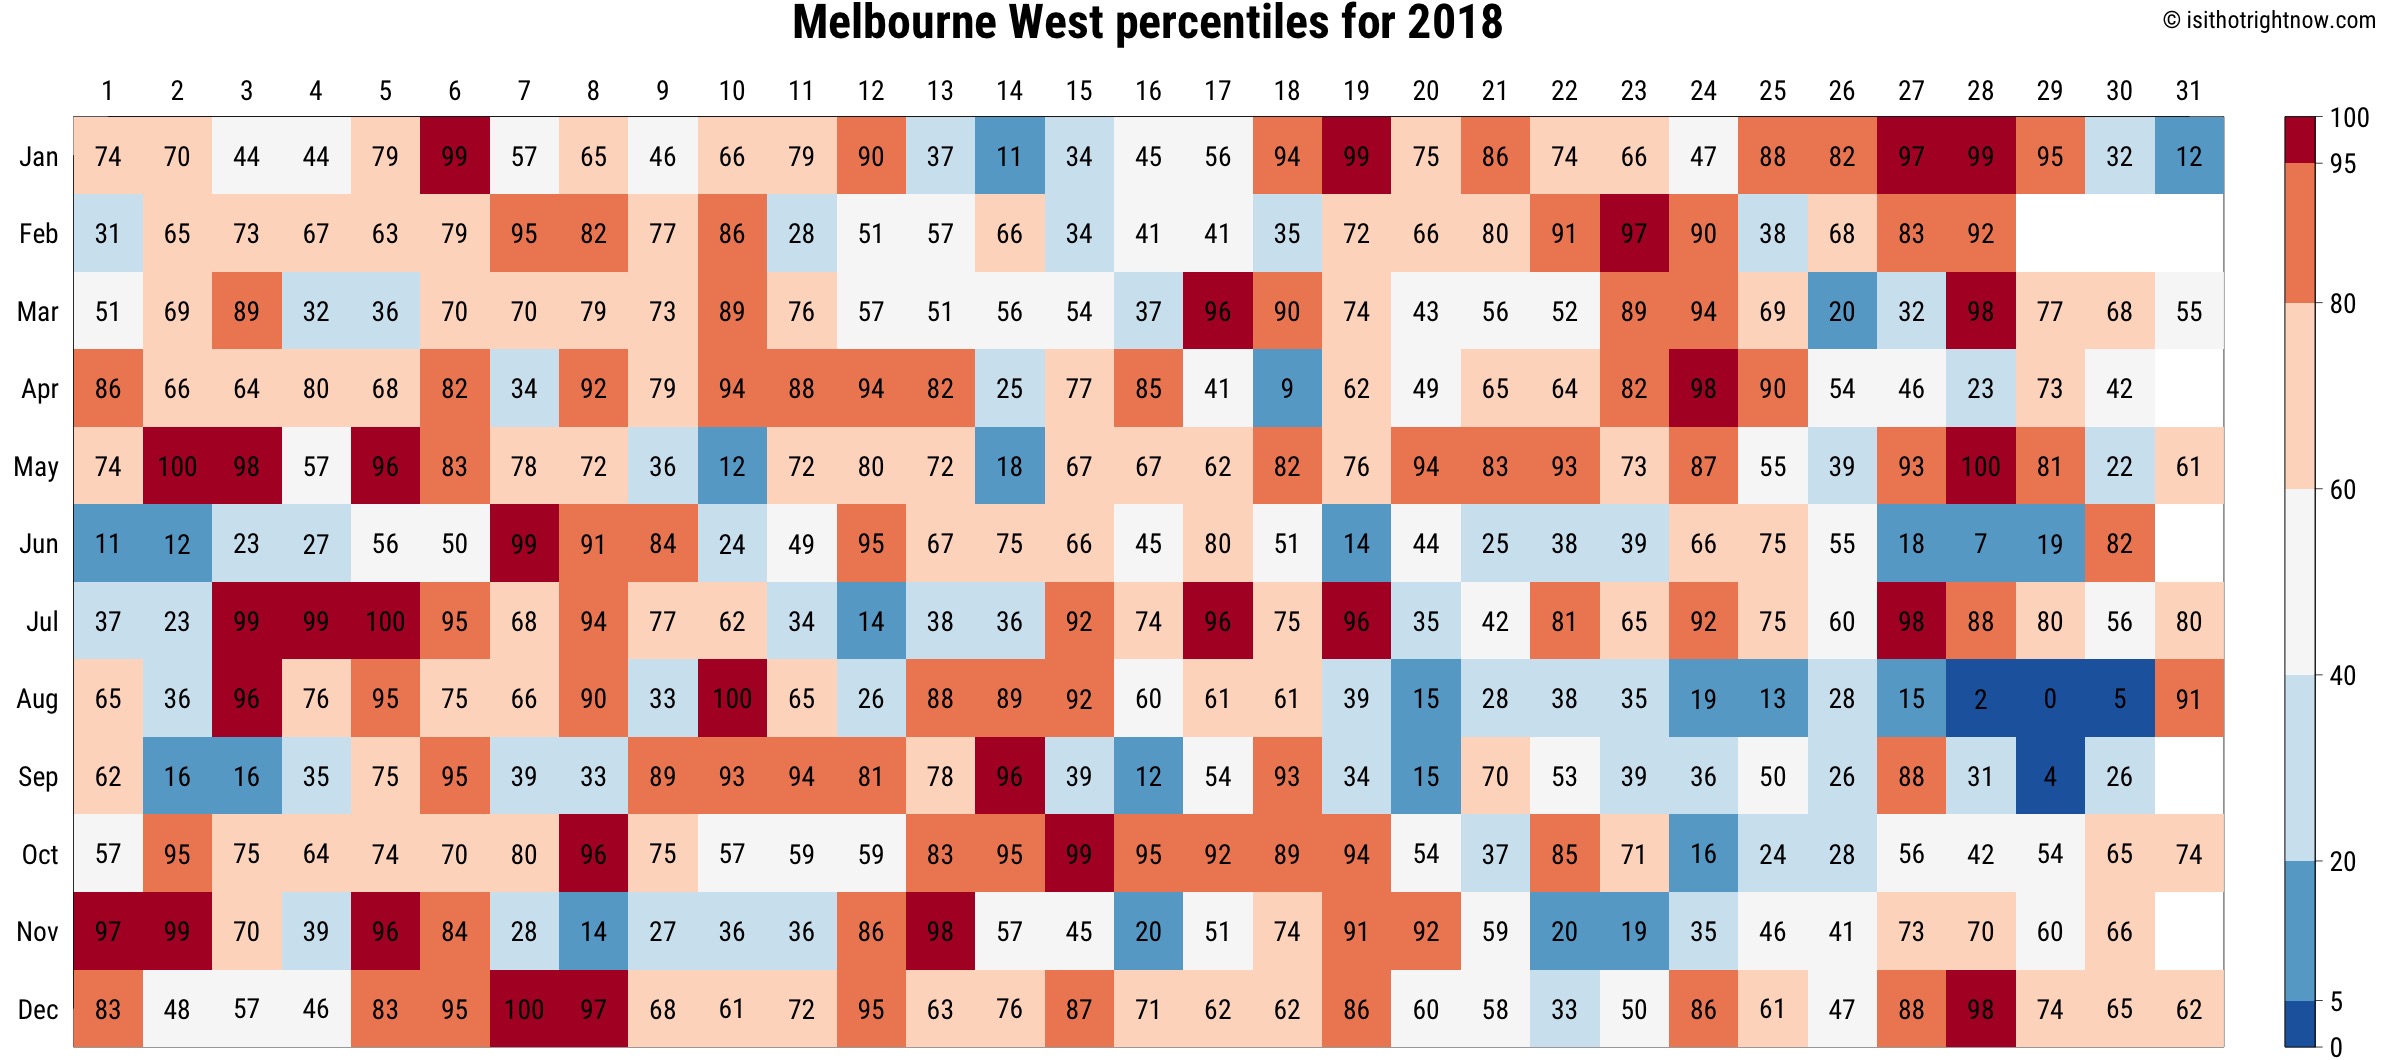
- Laverton (Western Melbourne)
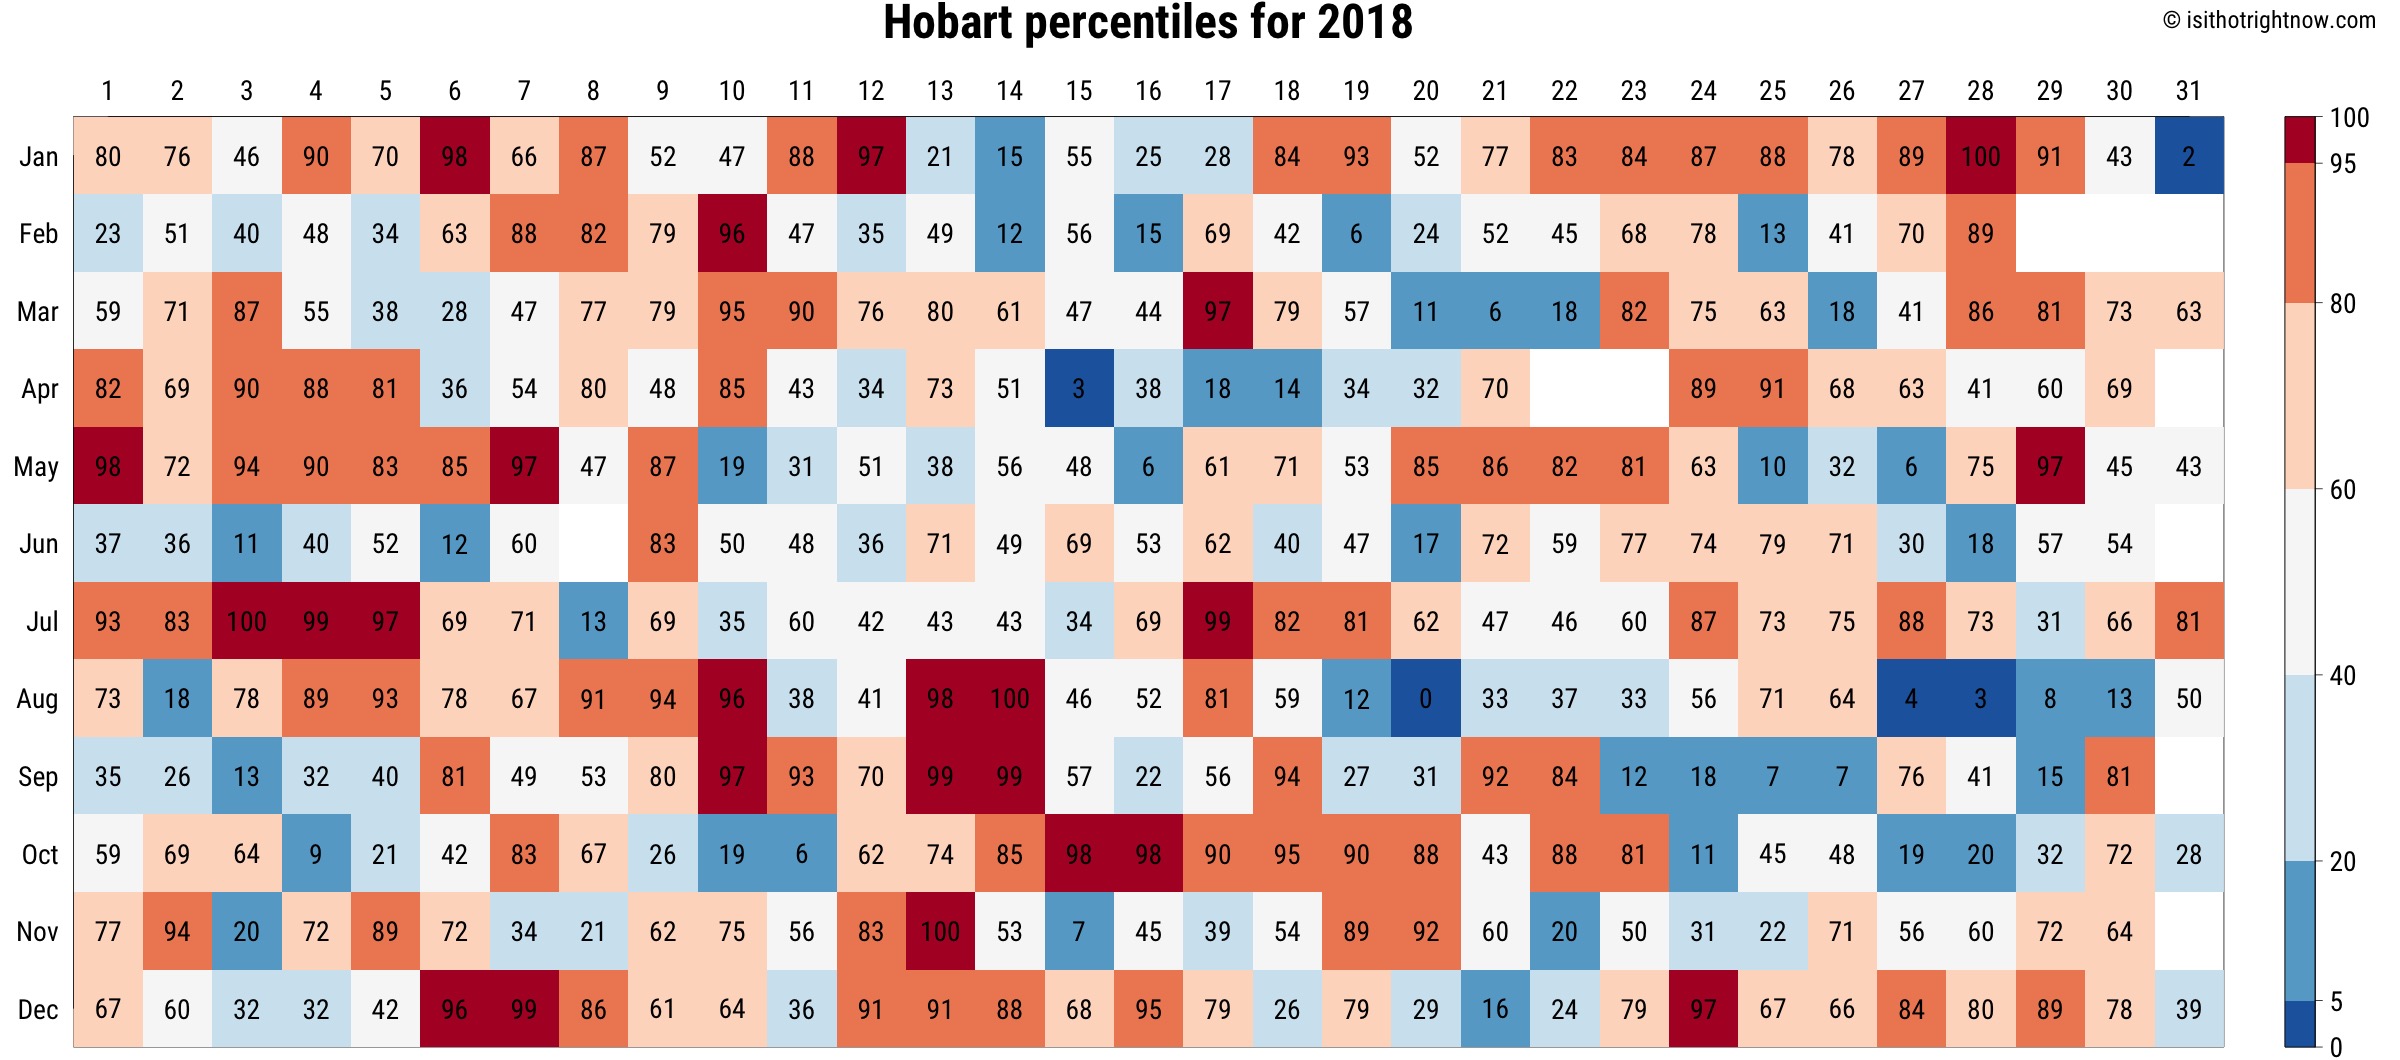
- Hobart
- Darwin
- Alice Springs
Data from isithotrightnow.com.
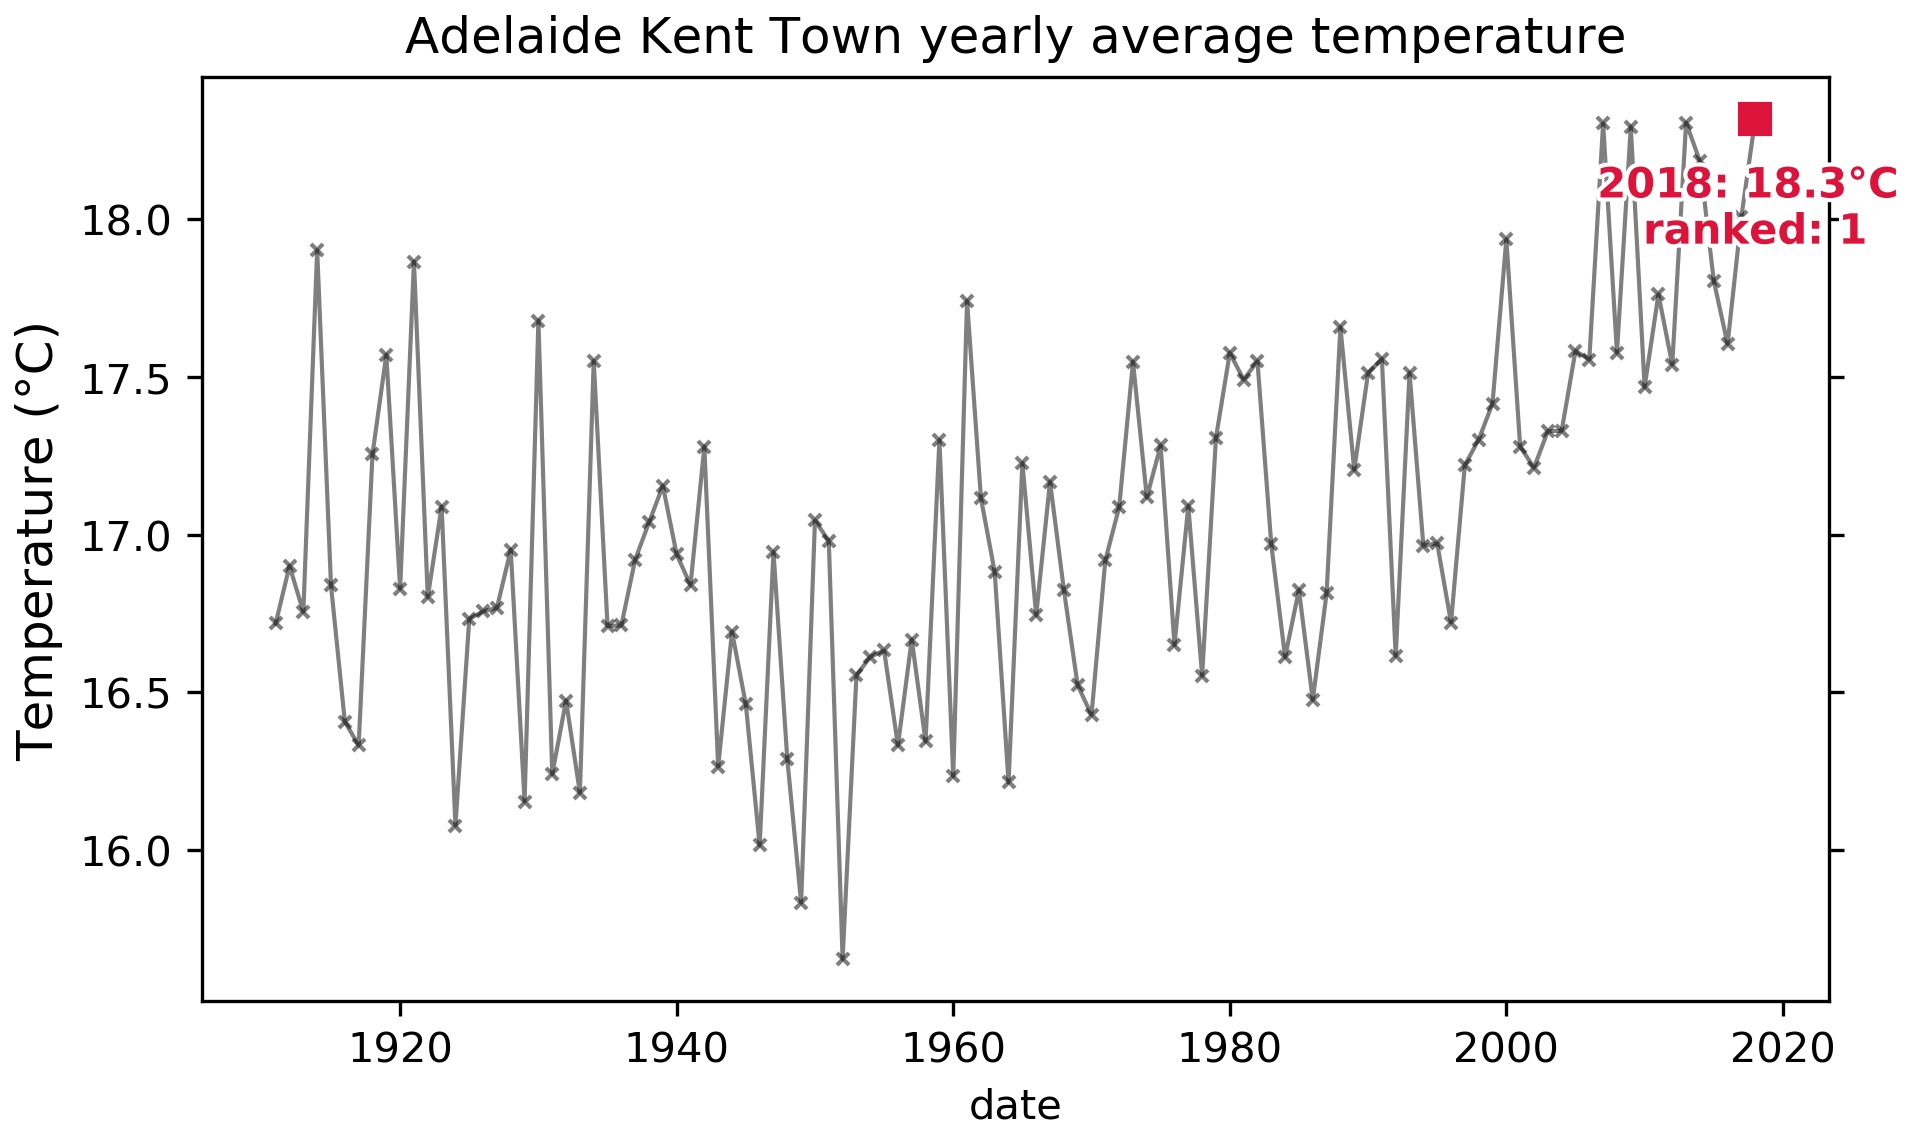
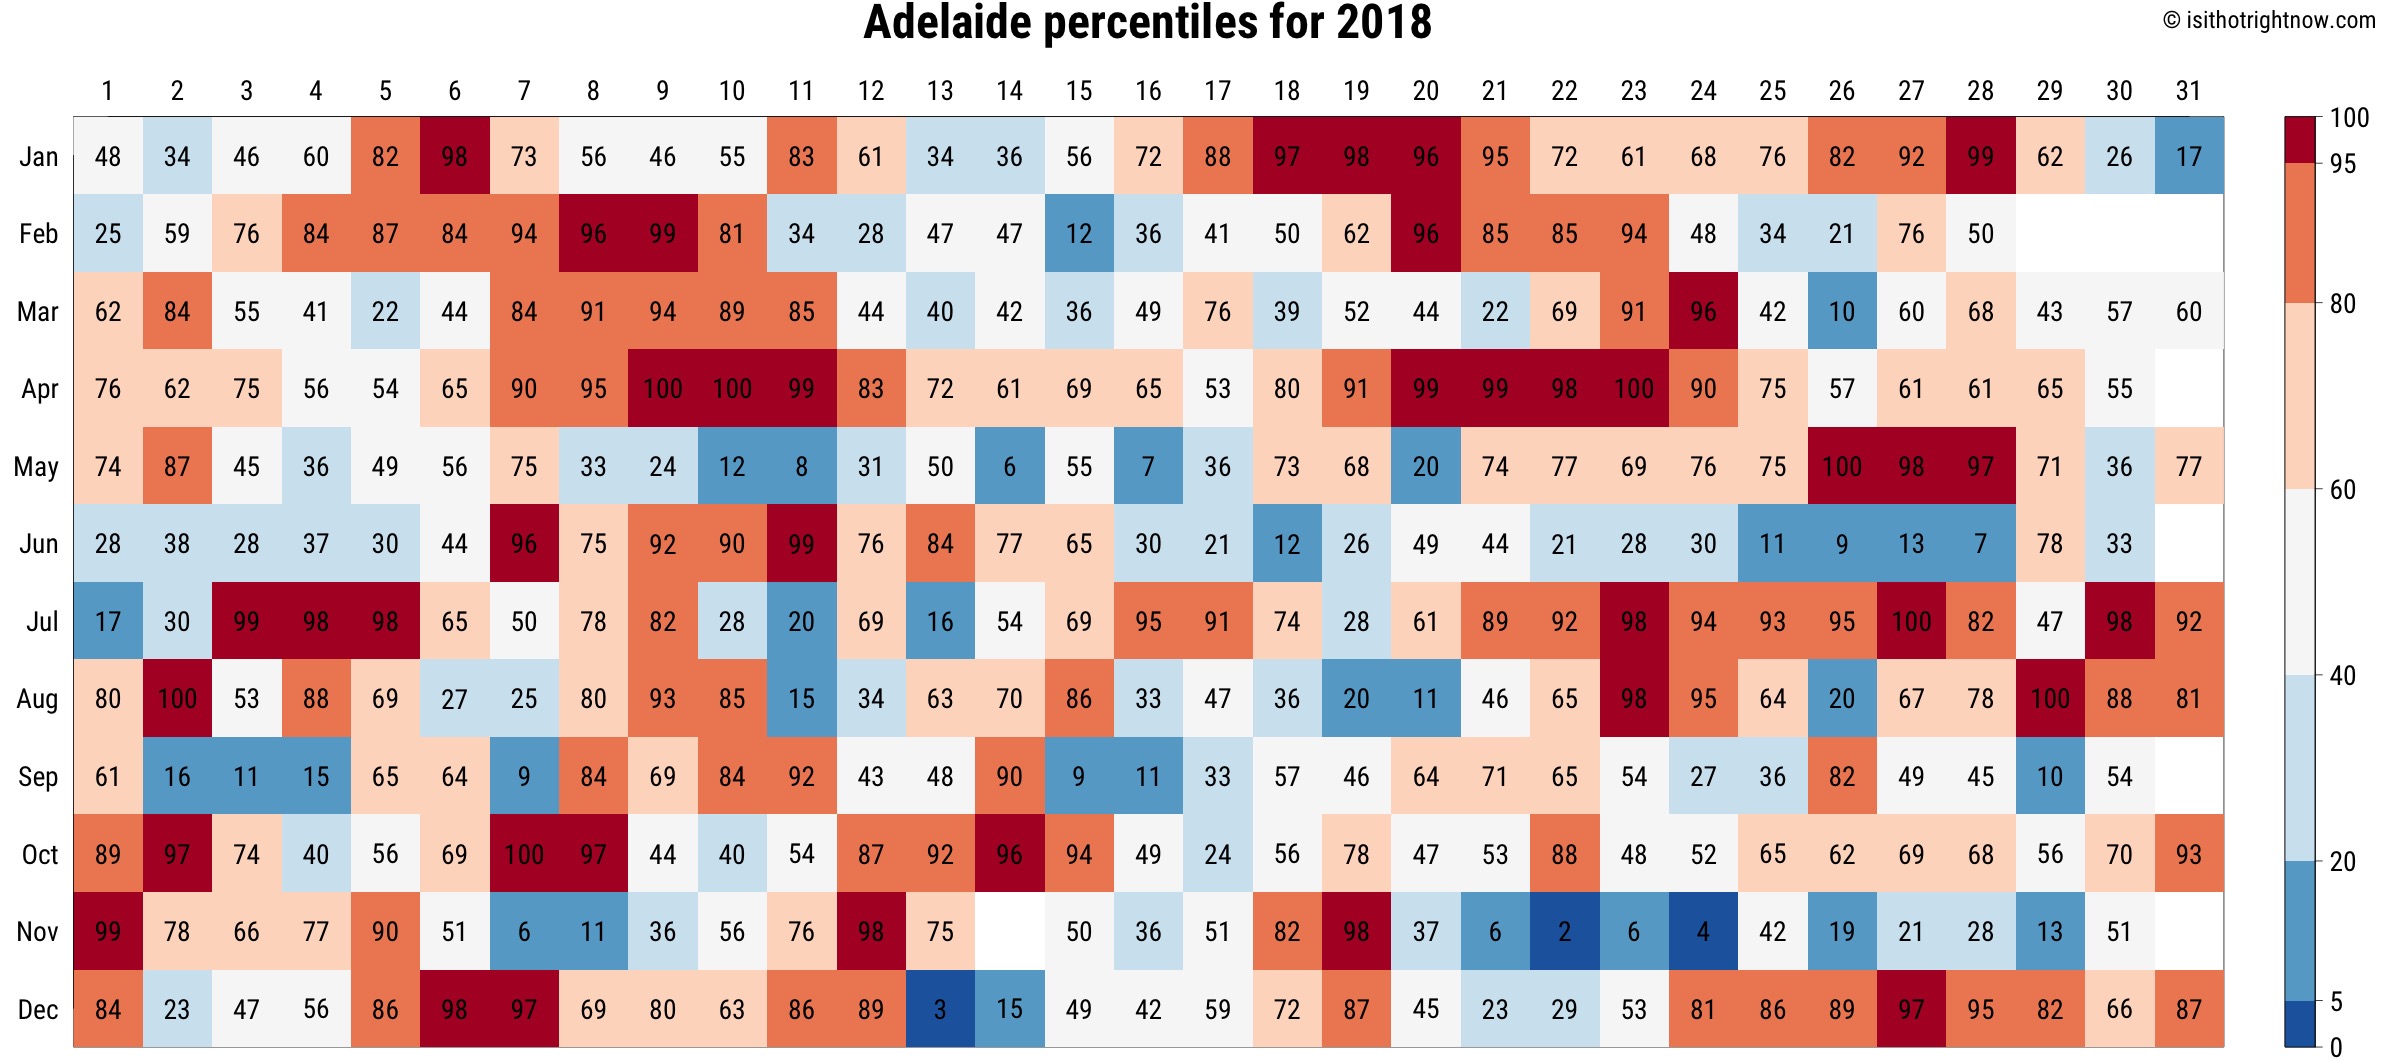
Adelaide (Kent Town)
Top 5
2018: 18.32°C
2013: 18.31°C
2007: 18.30°C
2009: 18.29°C
2014: 18.18°C
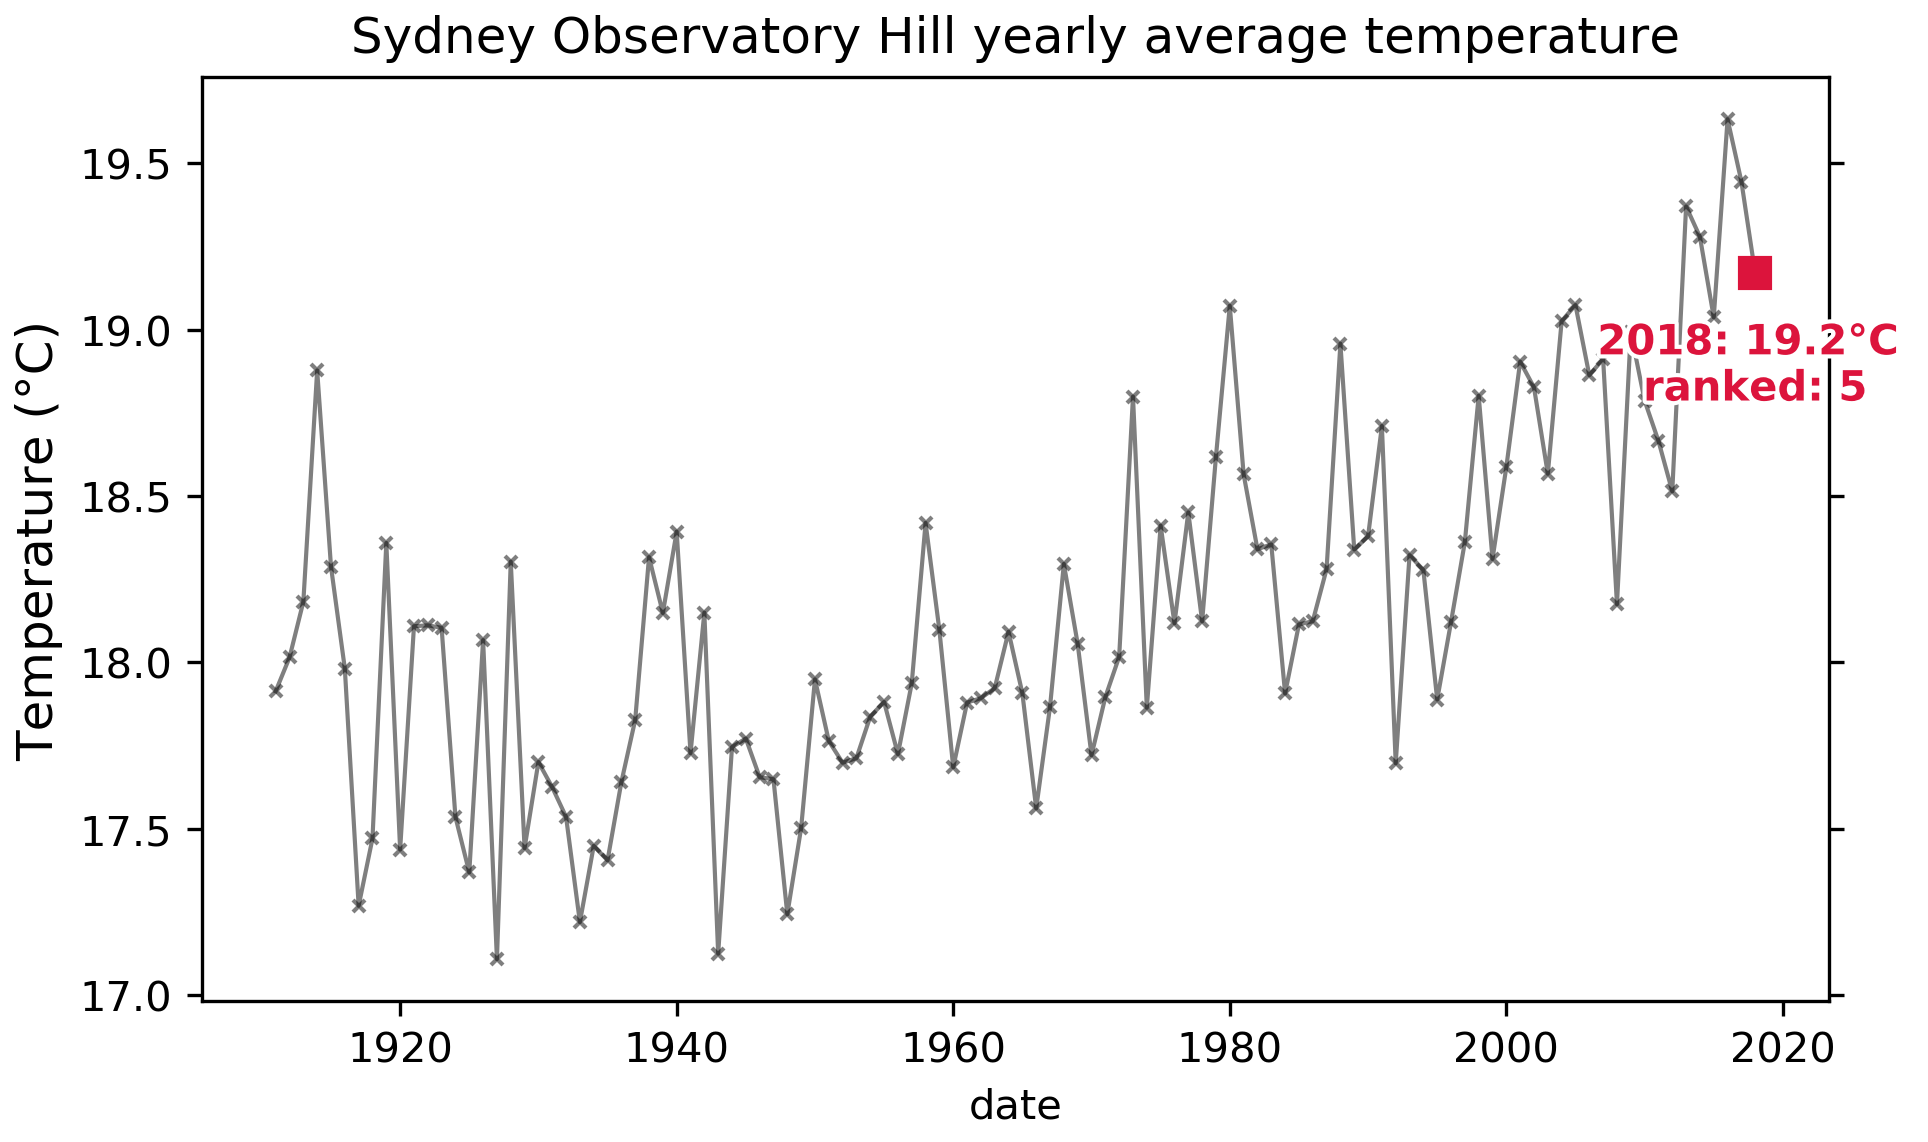
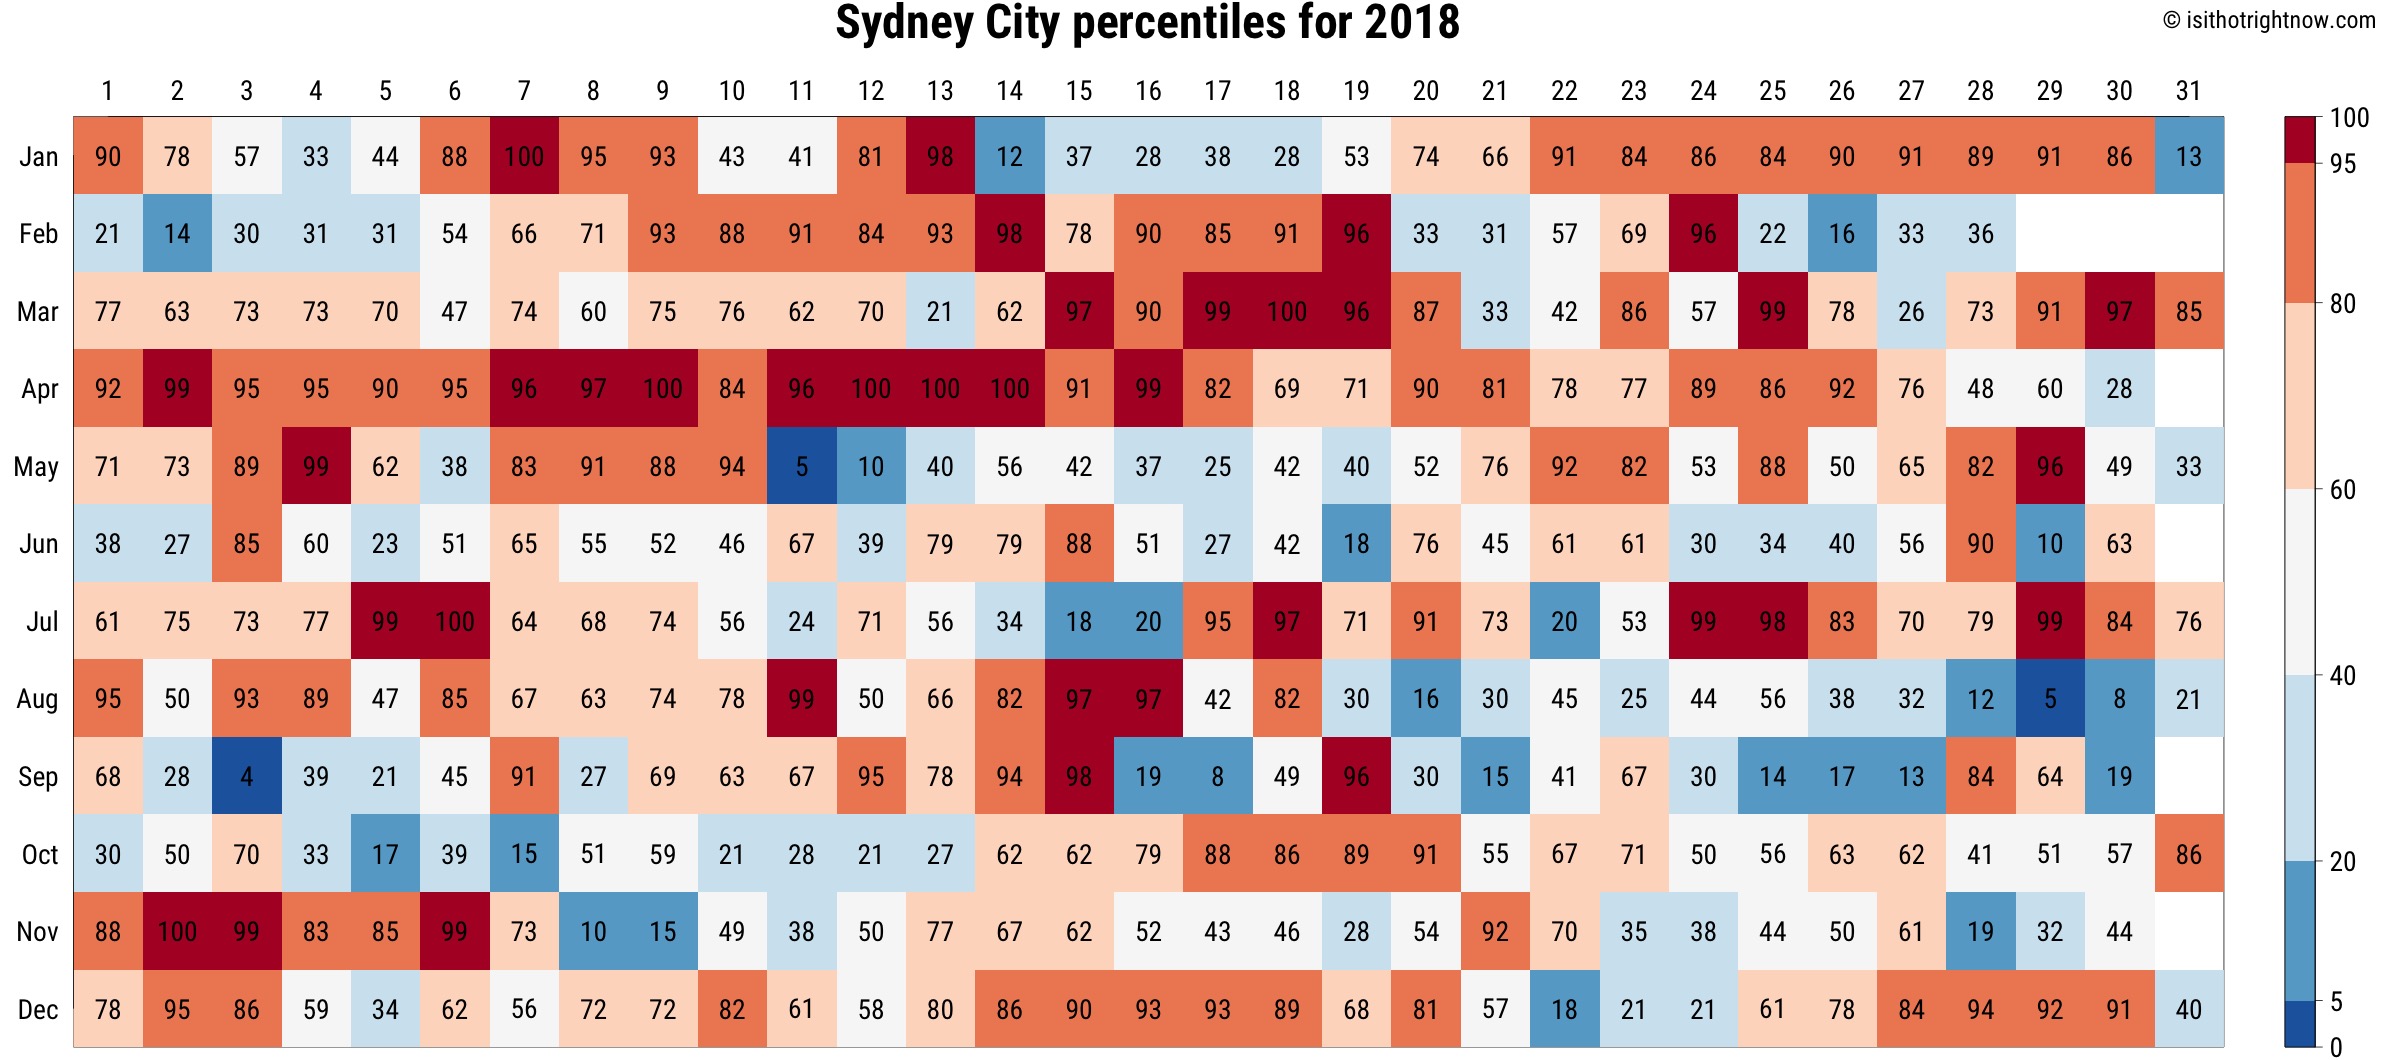
Sydney City
Top 5
2016: 19.63°C
2017: 19.45°C
2013: 19.37°C
2014: 19.28°C
2018: 19.17°C
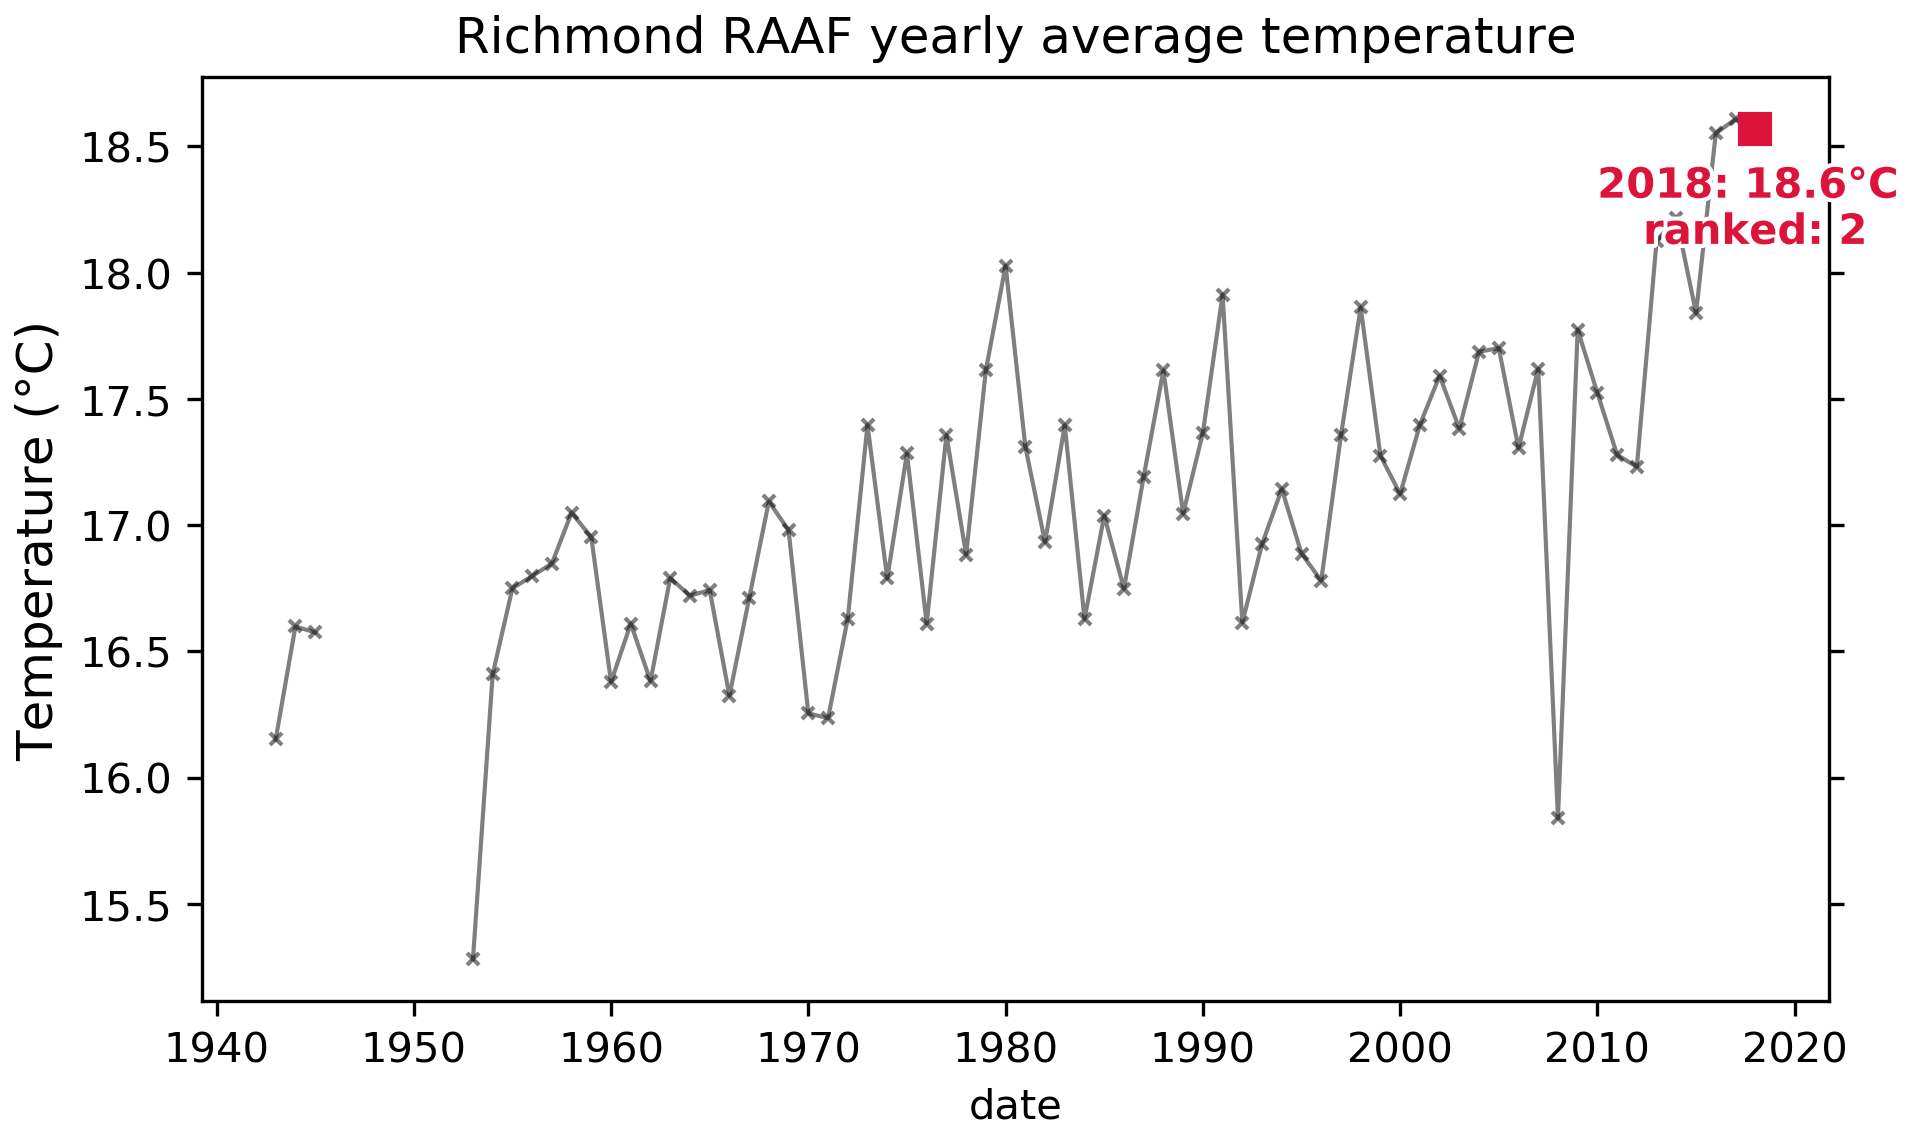
Richmond RAAF
Top 5
2017: 18.61°C
2018: 18.57°C
2016: 18.55°C
2014: 18.22°C
2013: 18.13°C
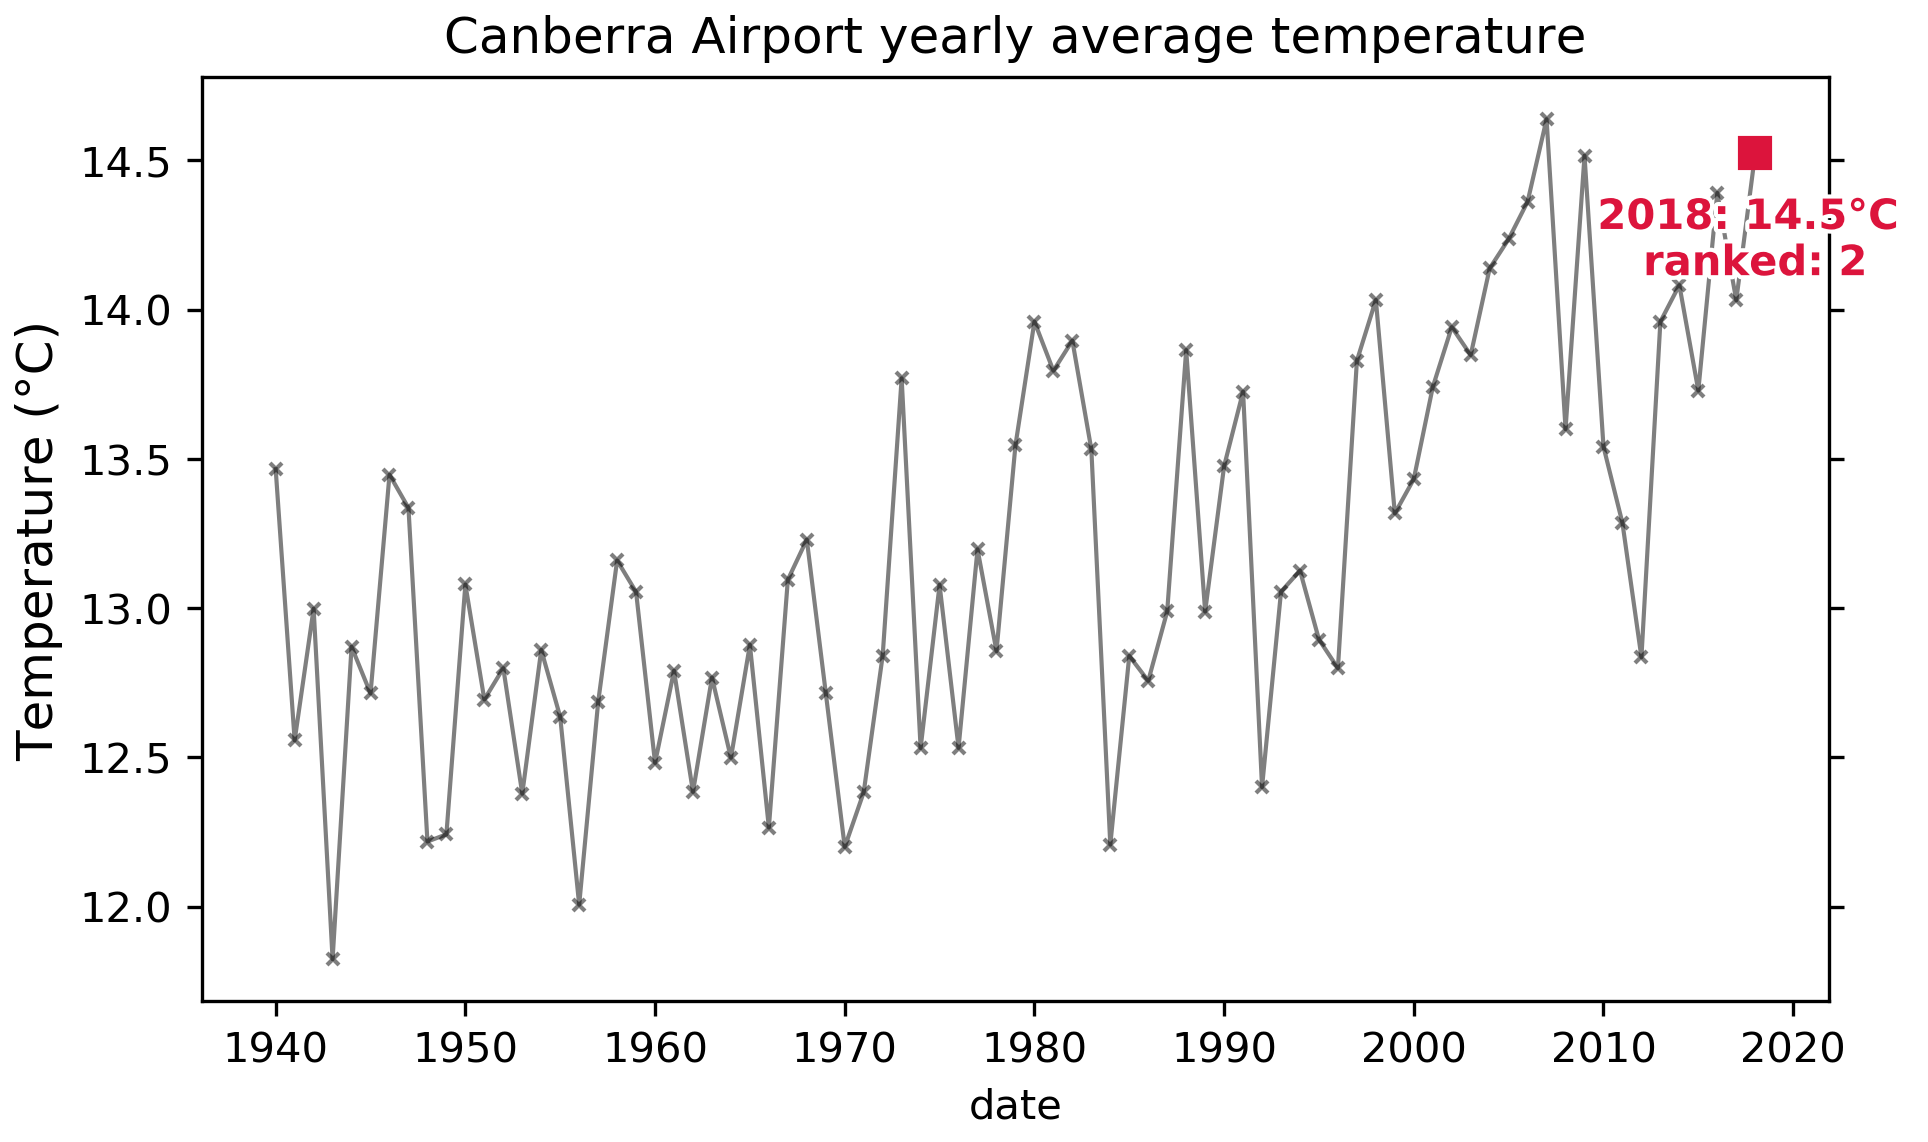
Canberra Airport
Top 5
2007: 14.64°C
2018: 14.52°C
2009: 14.52°C
2016: 14.39°C
2006: 14.36°C
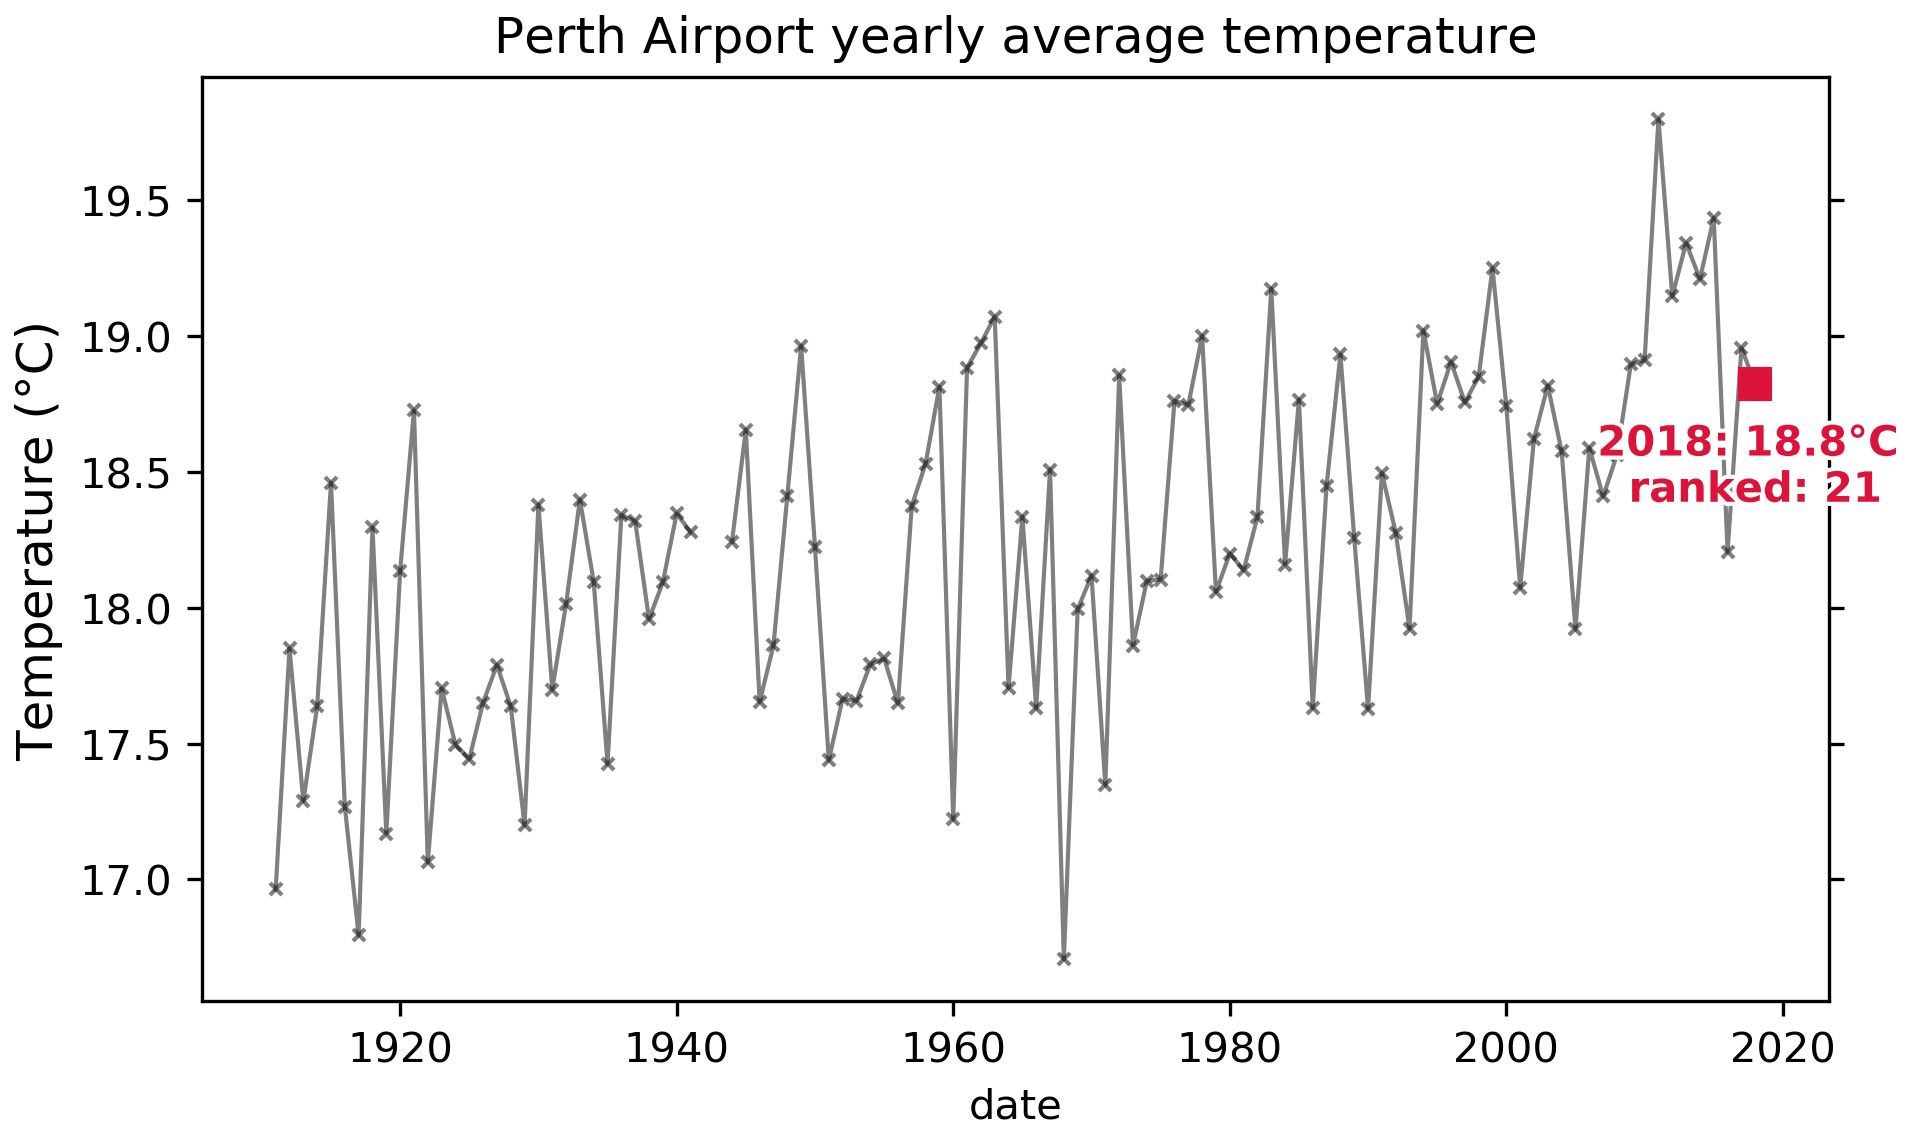
Perth Airport
Top 5
2011: 19.80°C
2015: 19.44°C
2013: 19.34°C
1999: 19.25°C
2014: 19.21°C
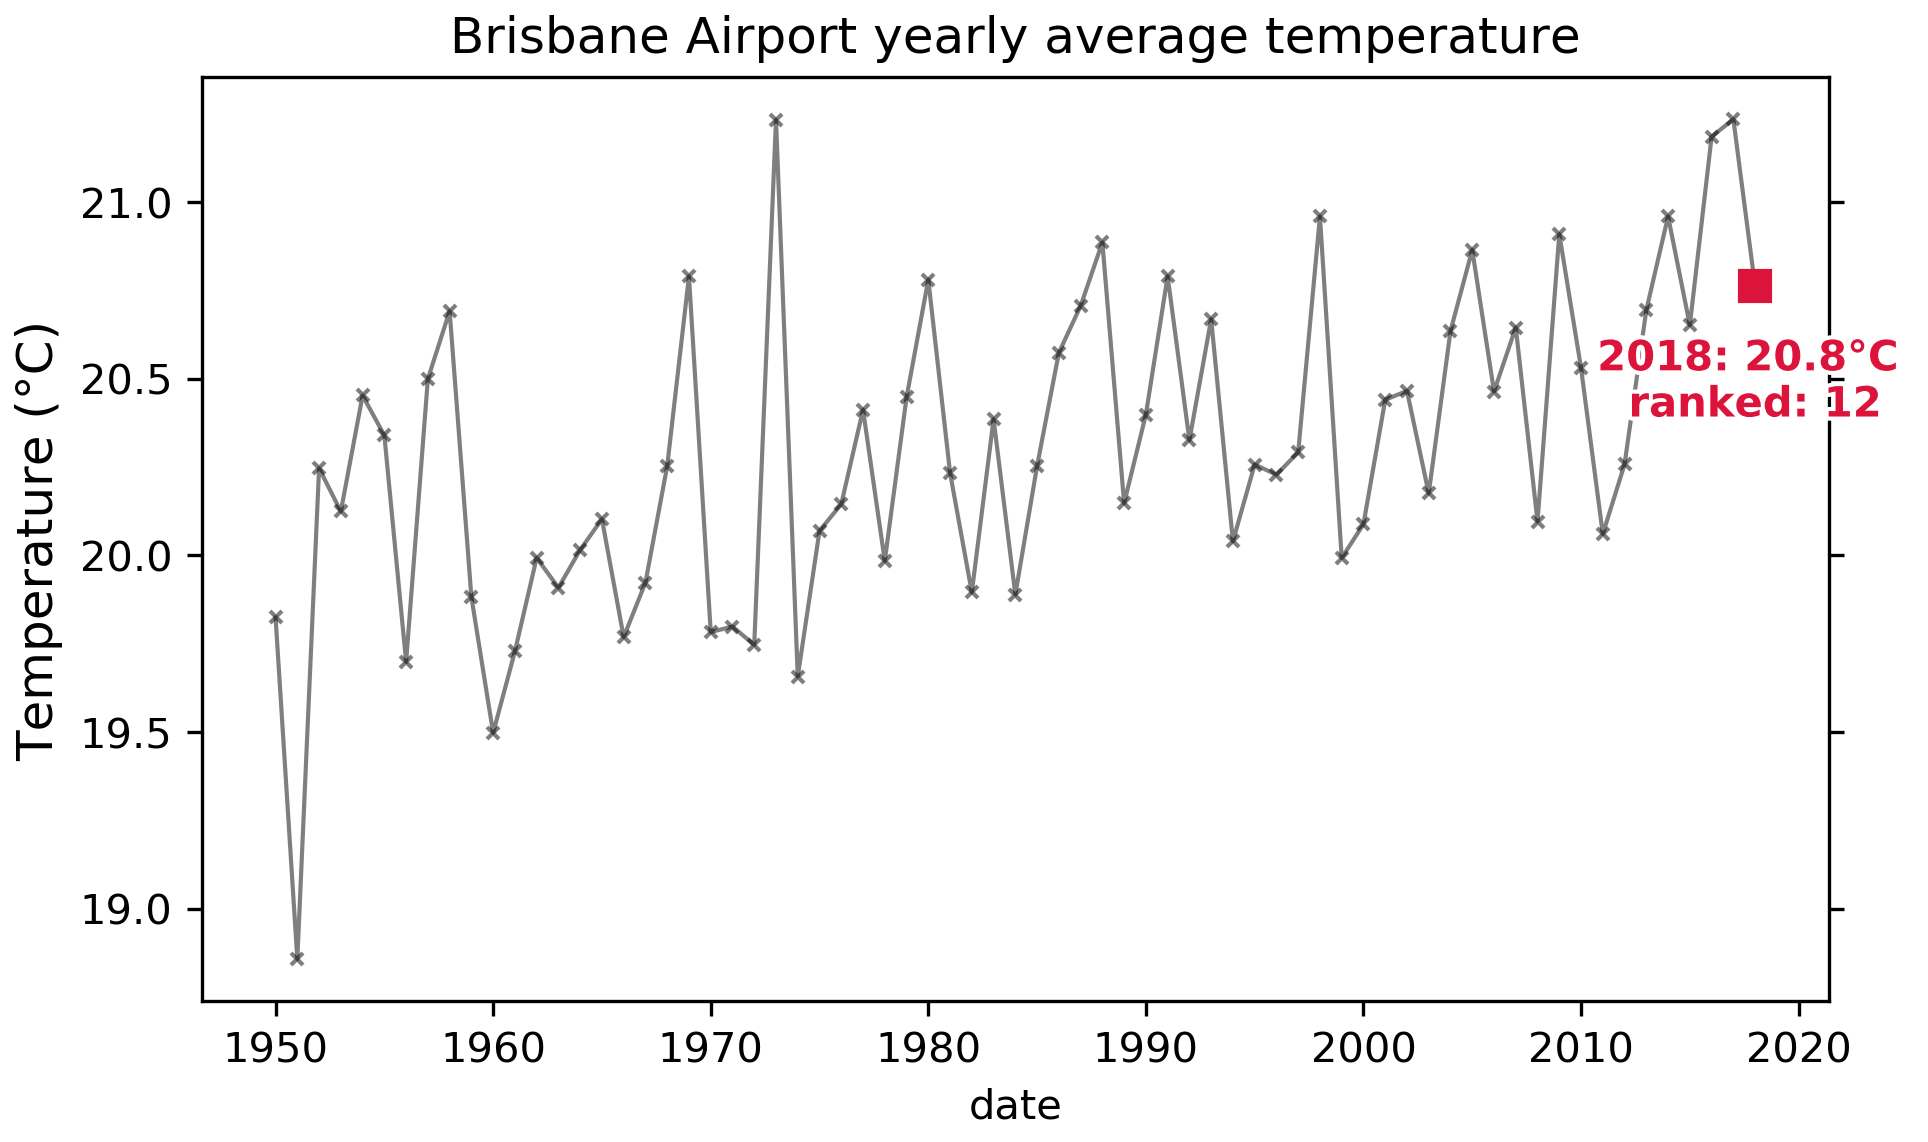
Brisbane Airport
Top 5
2017: 21.23°C
1973: 21.23°C
2016: 21.18°C
1998: 20.96°C
2014: 20.96°C
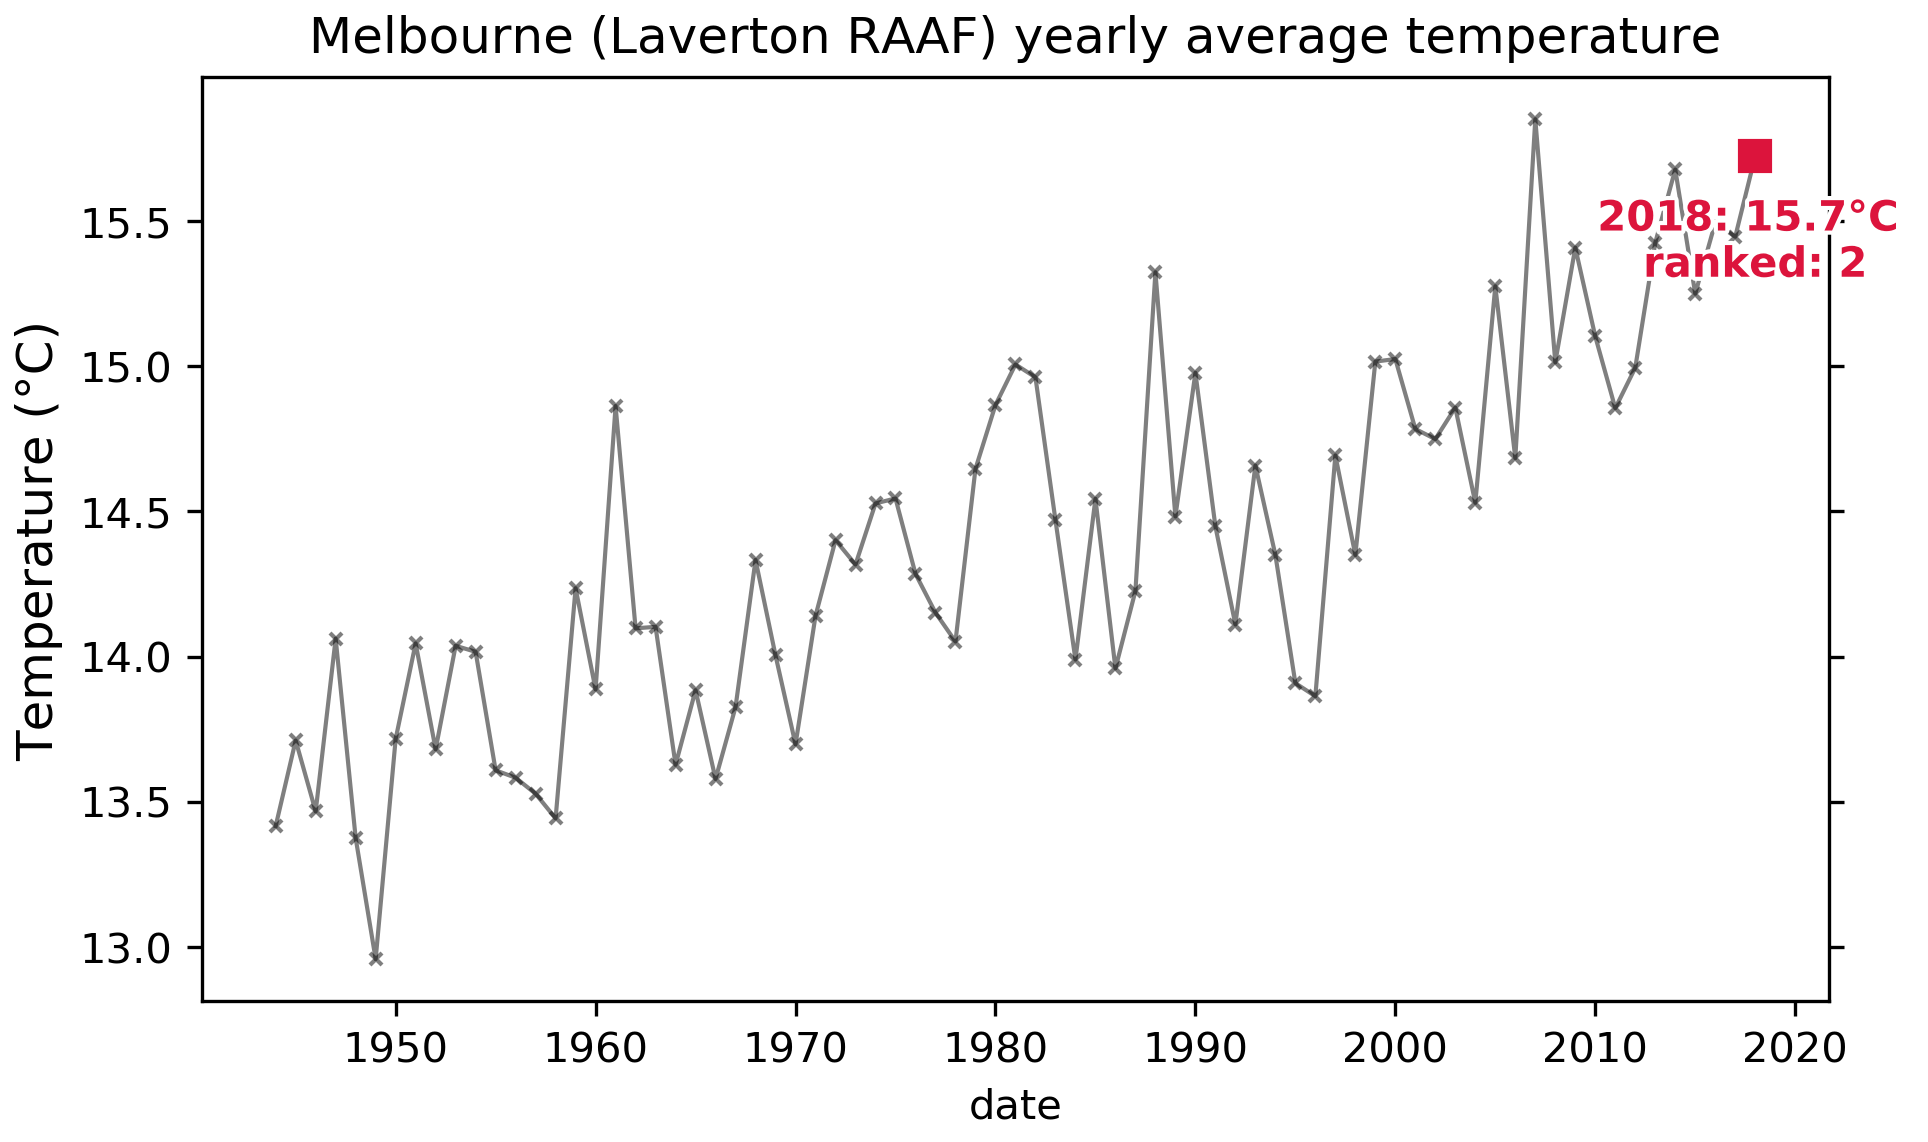
Melbourne (Laverton RAAF)
Top 5
2007: 15.85°C
2018: 15.72°C
2014: 15.68°C
2016: 15.49°C
2017: 15.45°C
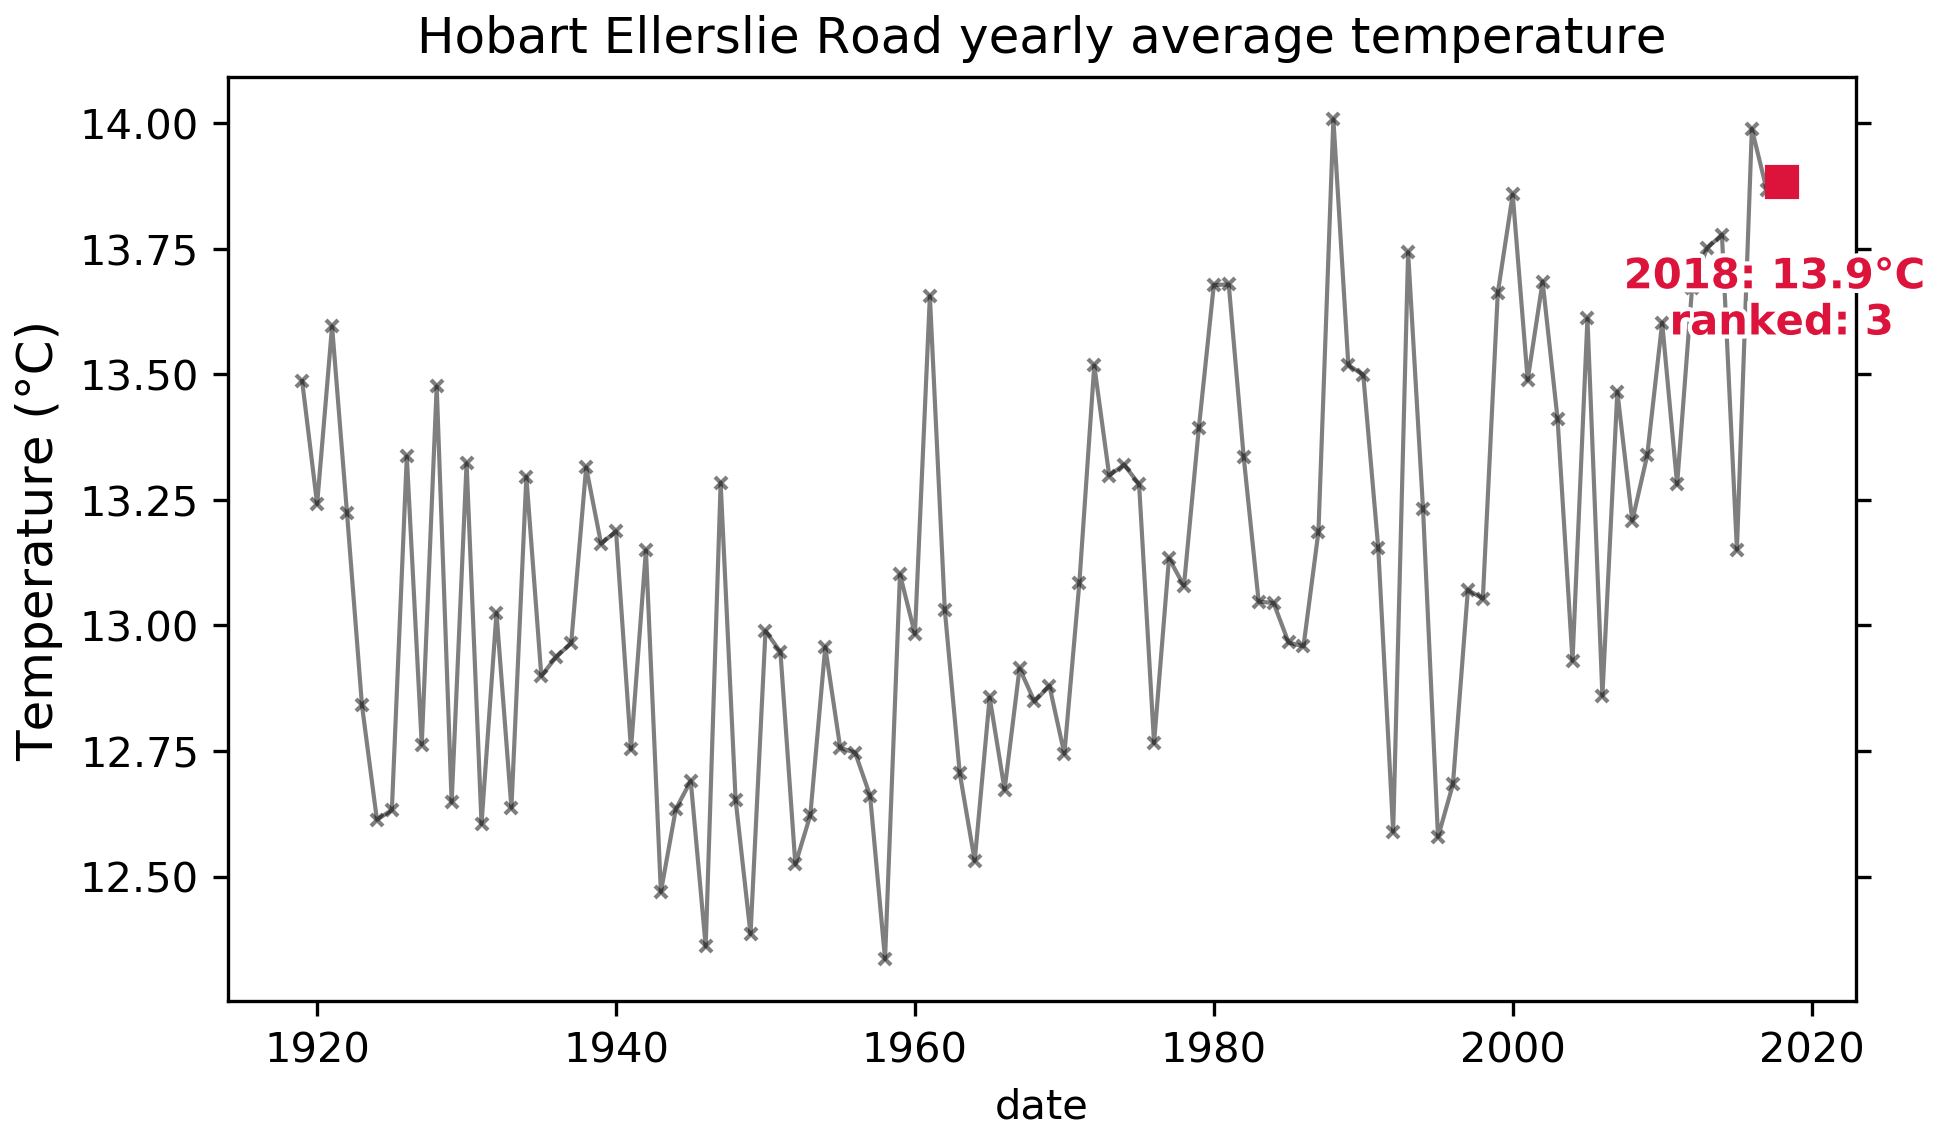
Hobart Ellerslie Road
Top 5
1988: 14.01°C
2016: 13.99°C
2018: 13.88°C
2017: 13.87°C
2000: 13.86°C
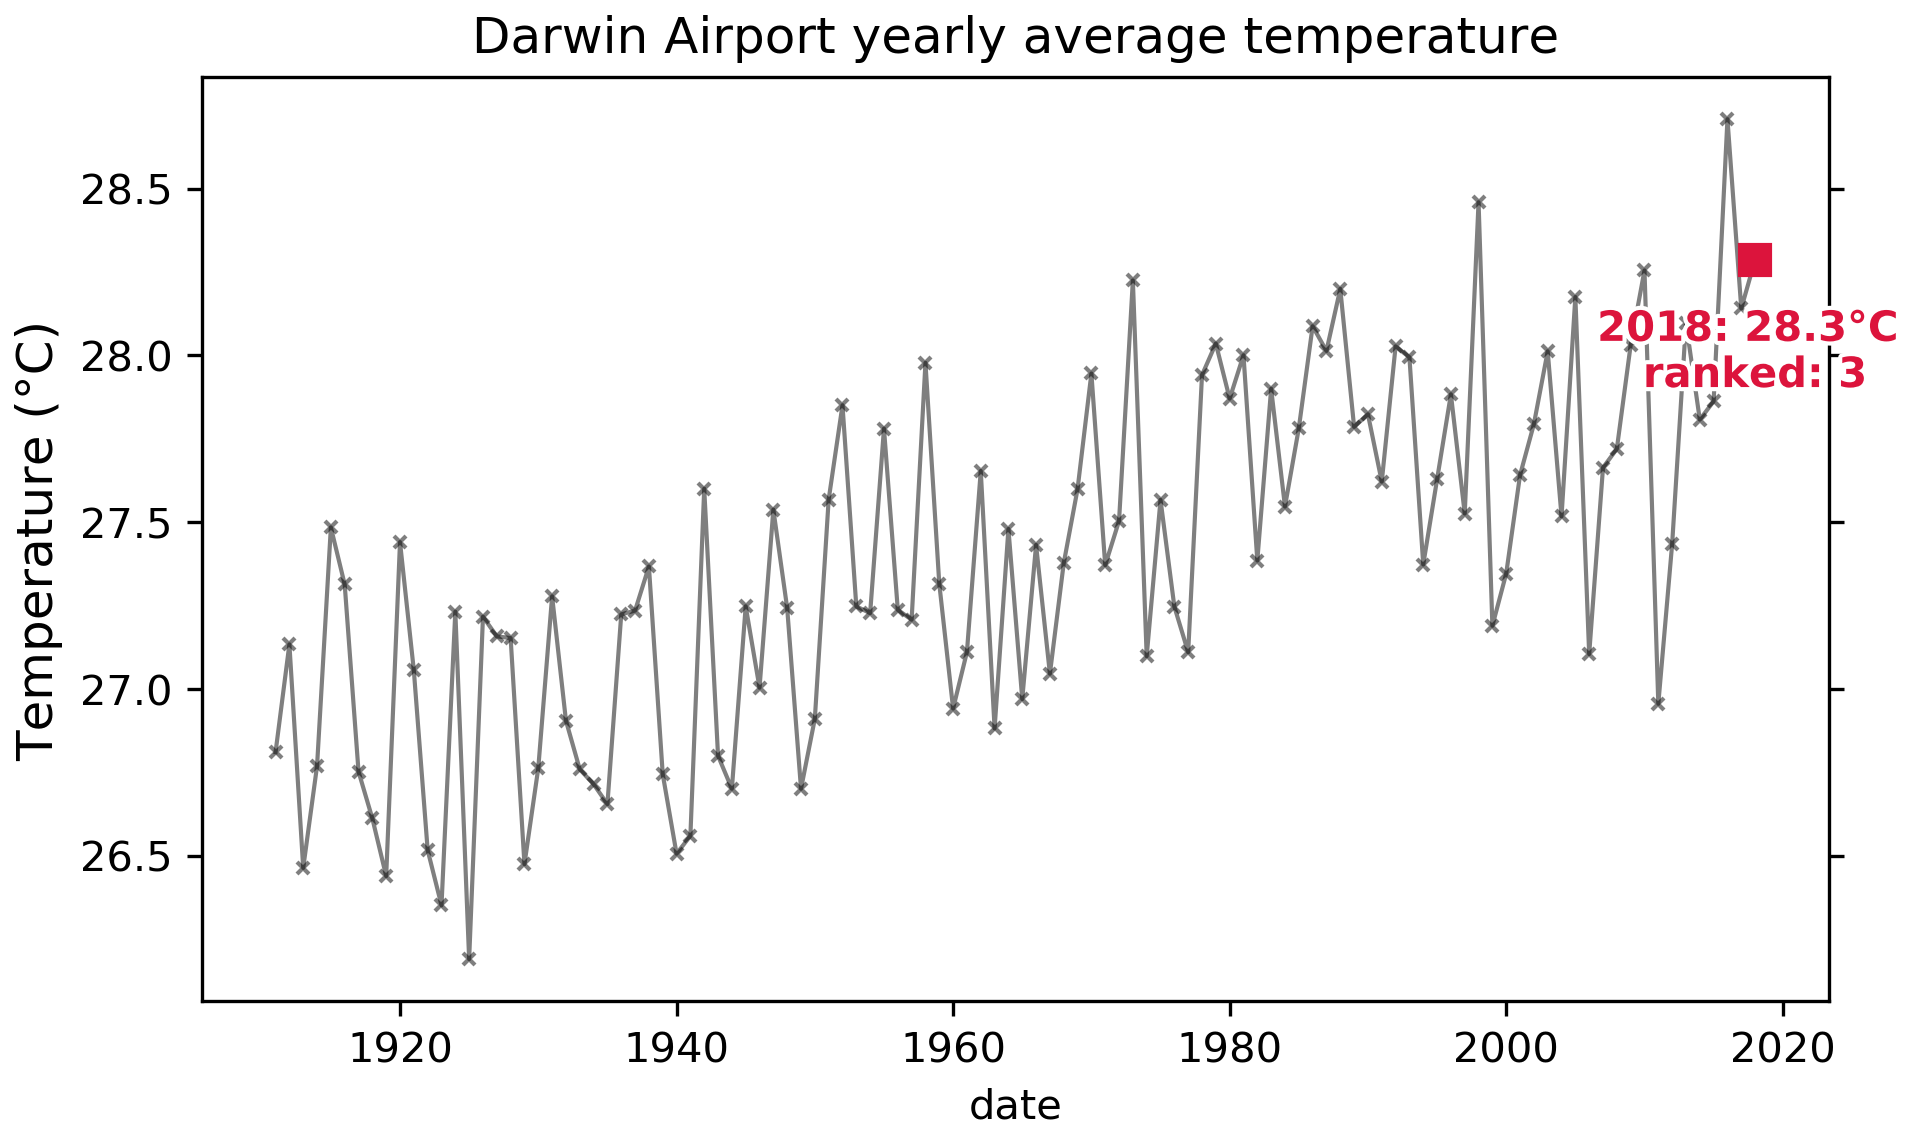
Darwin Airport
Top 5
2016: 28.71°C
1998: 28.46°C
2018: 28.29°C
2010: 28.25°C
1973: 28.22°C
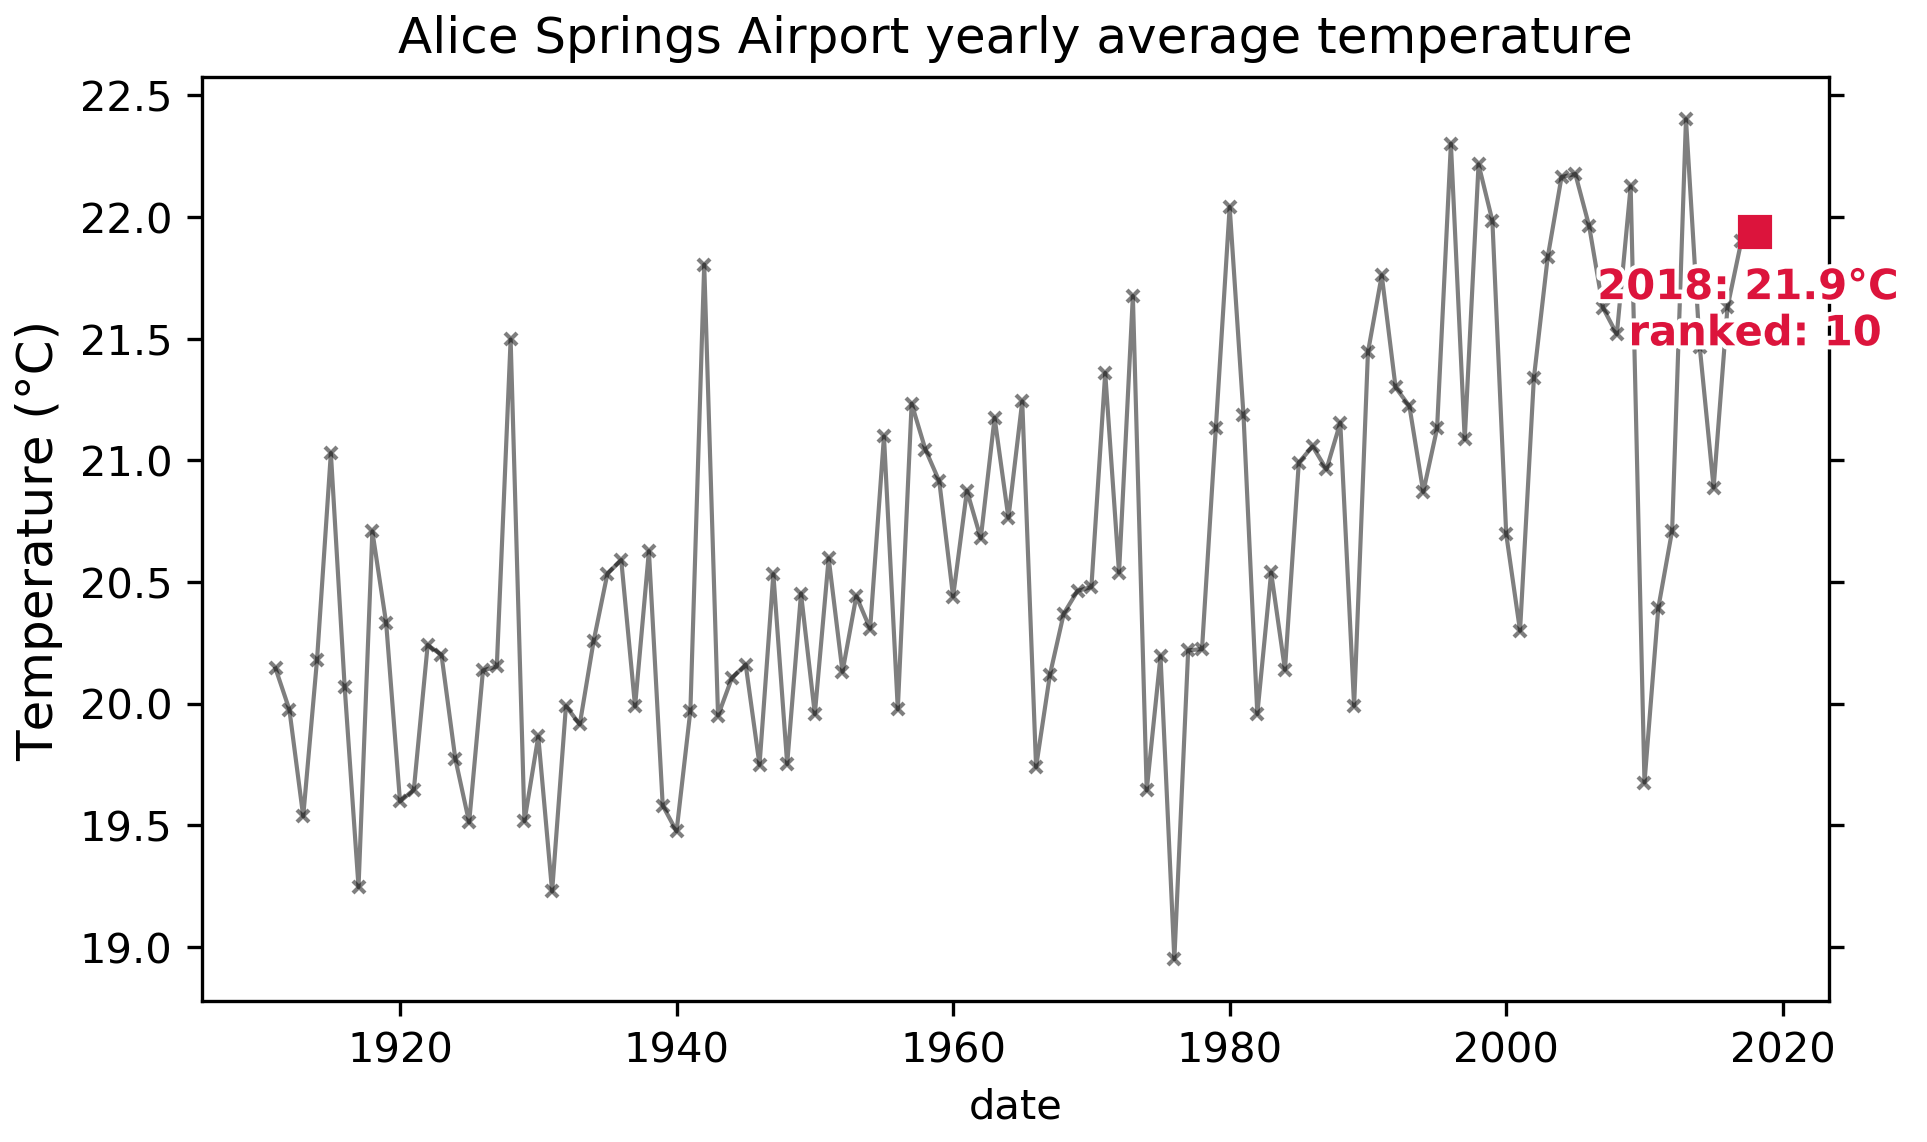
Alice Springs Airport
Top 5
2013: 22.40°C
1996: 22.30°C
1998: 22.22°C
2005: 22.18°C
2004: 22.16°C
NOTE
Historical data is from ACORN.SAT, while 2018 data was pulled live from the respective BOM sites per isithotrightnow.com feed. Therefore these results are indicative only. See the BOM website for more information.