This is an updated post to show how to build an xarray dataset from scratch.
I’ve also shown how to reproject datasets to other coordinate systems using rioxarray, and write CF compliant coordinate mapping information to allow correct loading into software like QGIS.
Create a dataset
I couldn’t find a good example online which creates an xarray dataset in one go. So… this code will create datasets with multiple variables and write it to netcdf.
The first example is a timeseries (one dimension of time), the second a spatial dataset (two dimensions of latitude/longitude).
import numpy as np
import xarray as xr
import pandas as pd

#### timeseries dataset ####

times = pd.date_range(start='2000-01-01',freq='1H',periods=6)

# create dataset
ds = xr.Dataset({
    'data1': xr.DataArray(
                data   = np.random.random(6),   # enter data here
                dims   = ['time'],
                coords = {'time': times},
                attrs  = {'long_name': 'random data', 'units': 'm'}
                ),
    'data2': xr.DataArray(
                data   = np.random.random(6),   # enter data here
                dims   = ['time'],
                coords = {'time': times},
                attrs  = {'long_name': 'random data', 'units': 'm'}
                )
            },
        attrs = {'example_attr': 'this is a global attribute'}
    )

# save datasets
ds.to_netcdf('temporal.nc',format='NETCDF4')

#### spatial dataset ####

lats = np.linspace(-33,-34,101)
lons = np.linspace(150,151,101)

ds = xr.Dataset({
    'data1': xr.DataArray(
        data = np.random.rand(101,101),
        dims = ['latitude','longitude'],
        coords = {'latitude': lats, 'longitude': lons},
        attrs = {'long_name': 'random data', 'units': 'm'}
        ),
    'data2': xr.DataArray(
        data = np.random.rand(101,101),
        dims = ['latitude','longitude'],
        coords = {'latitude': lats, 'longitude': lons},
        attrs = {'long_name': 'random data', 'units': 'm'}
        )
    },
    attrs = {'example_attr': 'this is a global attribute'}
    )

# save datasets
ds.to_netcdf('spatial.nc',format='NETCDF4')
Apply compression
To write out with compression, each variable in the dataset needs to be encoded, leading to much reduced filesizes for large datasets.
We can also add other encoding such as _FillValue here.
Suggestions online for applying encoding often recommend
using dictionary comprehension and setting encoding=encoding when writing to netcdf.
However this ignores any existing encoding. I now prefer to update the variable
encoding directly:
# update encoding
for key in ds.data_vars:
    ds[key].encoding.update({'zlib':True, '_FillValue':-999.})

# save to netcdf
ds.to_netcdf('spatial_compressed.nc', format='NETCDF4')
Reproject to other coordinate systems and write to .nc or .tif
If dealing with other types of geospatial data such as geotiffs, or remapping between different coordinate systems, a useful secondary python package is rioxarray.
It can read in tifs, reproject data or apply different crs metadata. Here I apply the crs epsg:4326 (latitude and longitude), reproject to an the Web Mercator projection (epgs:3857) which uses coordinates in metres rather than lat/lon values.
import rioxarray as rxr

# apply lat/lon crs
ds.rio.write_crs('epsg:4326', inplace=True)

# reproject to a new crs coordinate (this one uses metres)
ds_proj = ds.rio.reproject('epsg:3857')

# save to netcdf
ds_proj.to_netcdf('reproject.nc',format='NETCDF4')

# save to geotiff with compression
ds_proj.rio.to_raster('reproject.tif', compress='LZW')
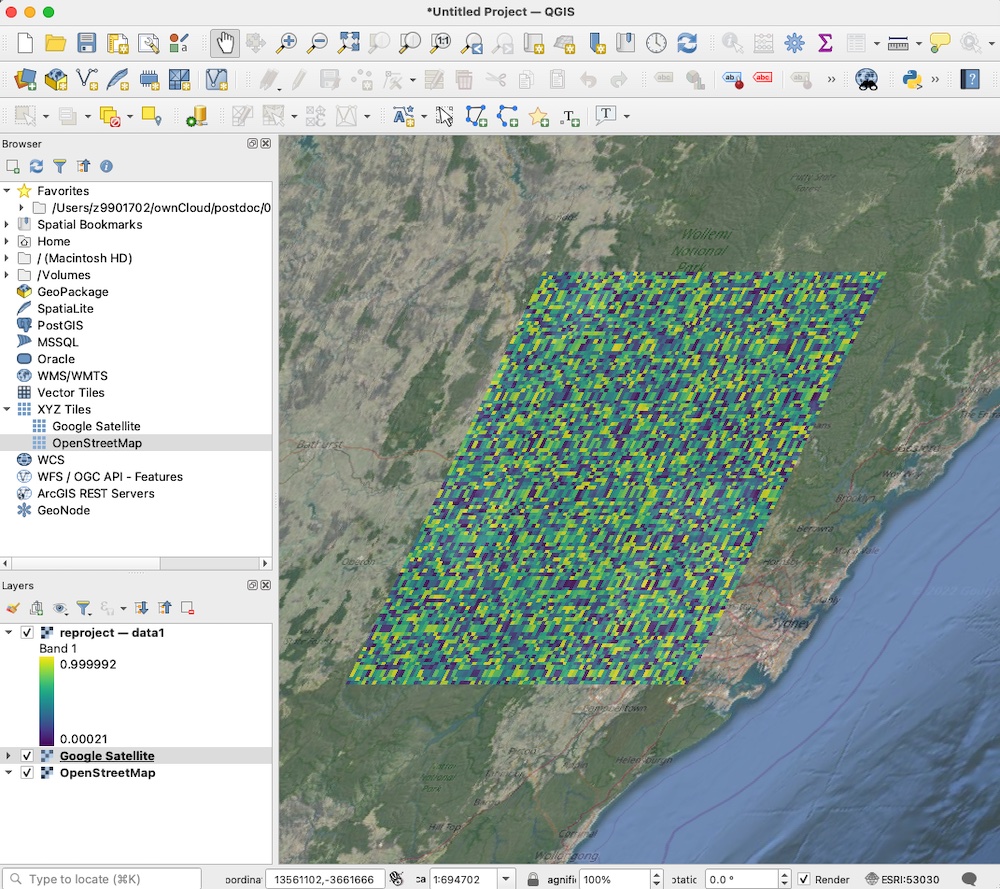
Write CF compliant netcdfs with any coordinate system
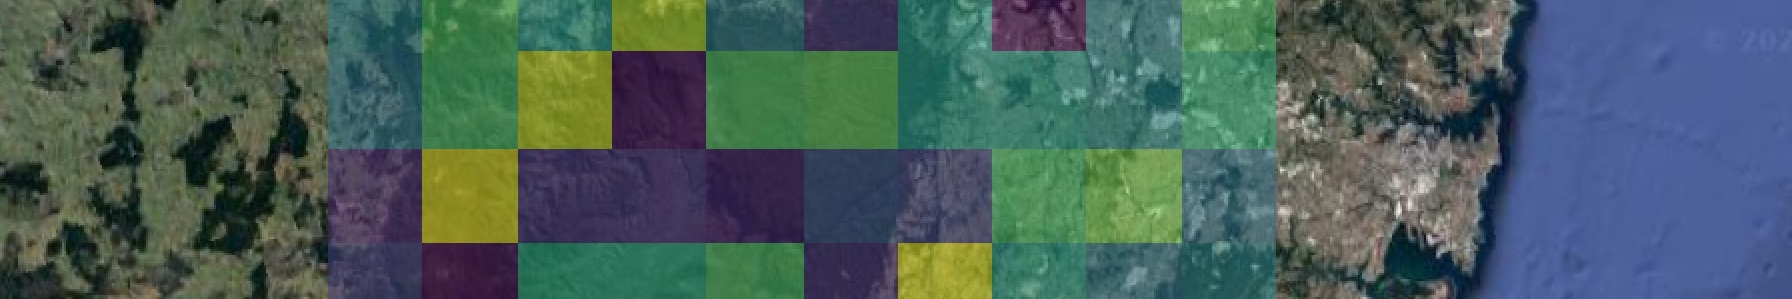
Using rioxarray to reproject has the advantage that output is CF compliant and can be interpreted by other software easily. For example, when loading this Mercator netcdf into QGIS, the projection displays correctly in lat/lon, and can then be compared with satellite or other data in any desired projection.