This post shows code to import OpenStreetMap and satellite images into Python’s Cartopy.
Inputs are:
- latitude
- longitude
- style (map or satellite)
- radius (of circle)
- npoints (number of random points to plot within the circle)
Note this is only complicated because of the satellite images, for only OpenStreetMap images just follow an example like this.
Basis
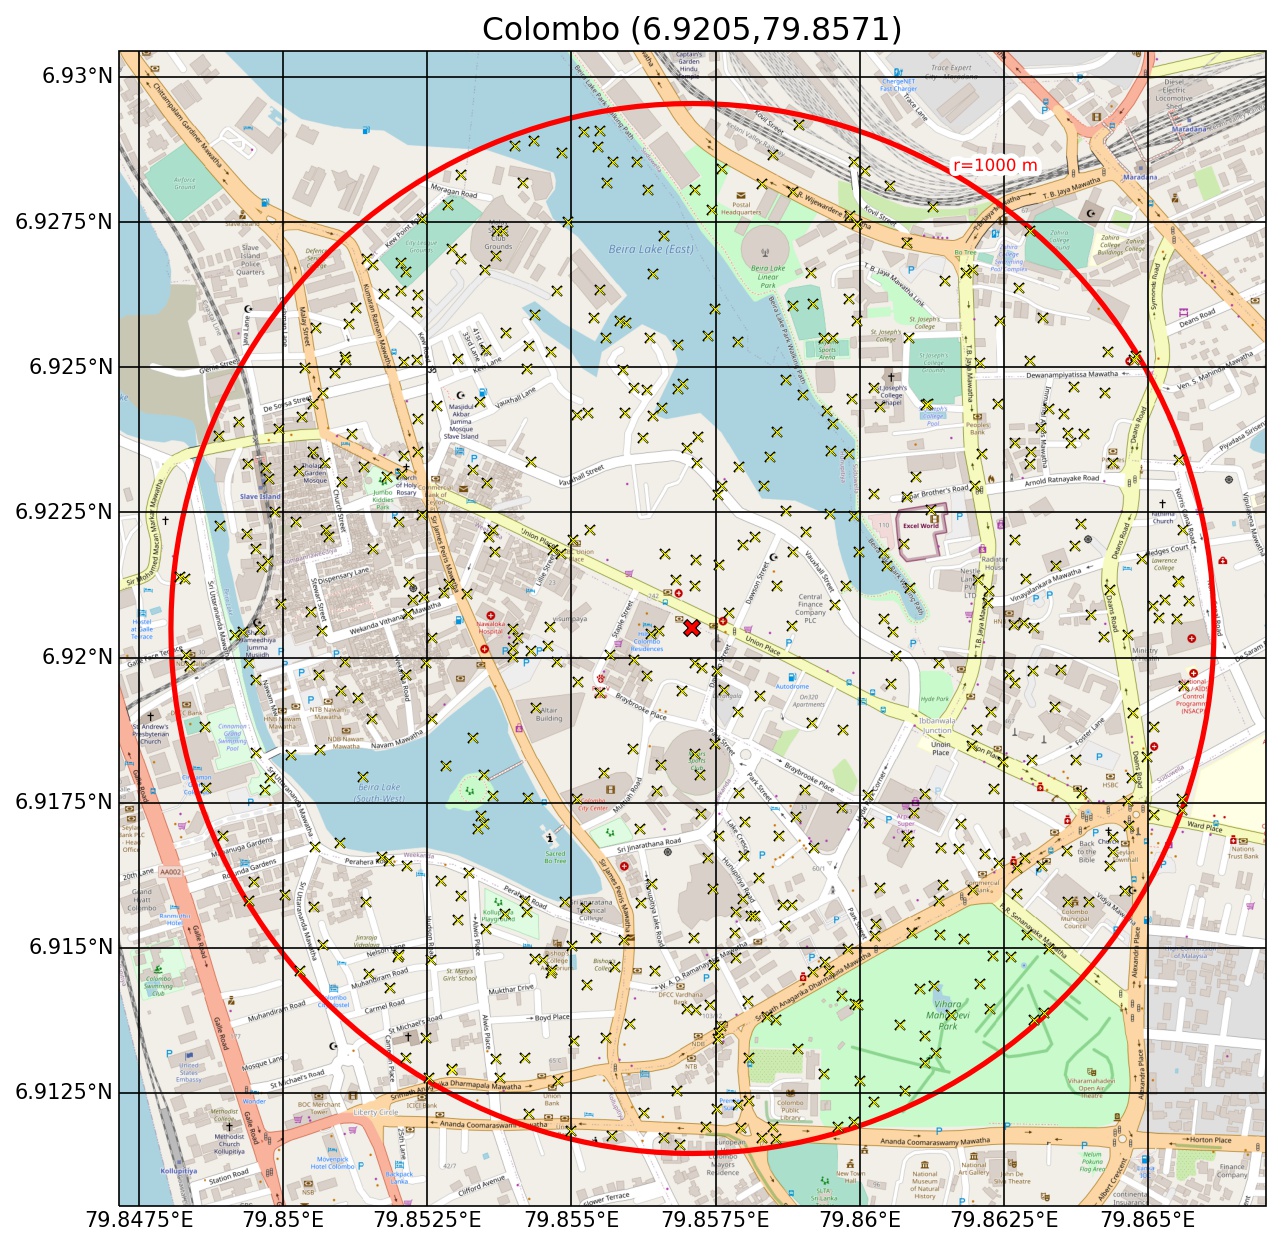
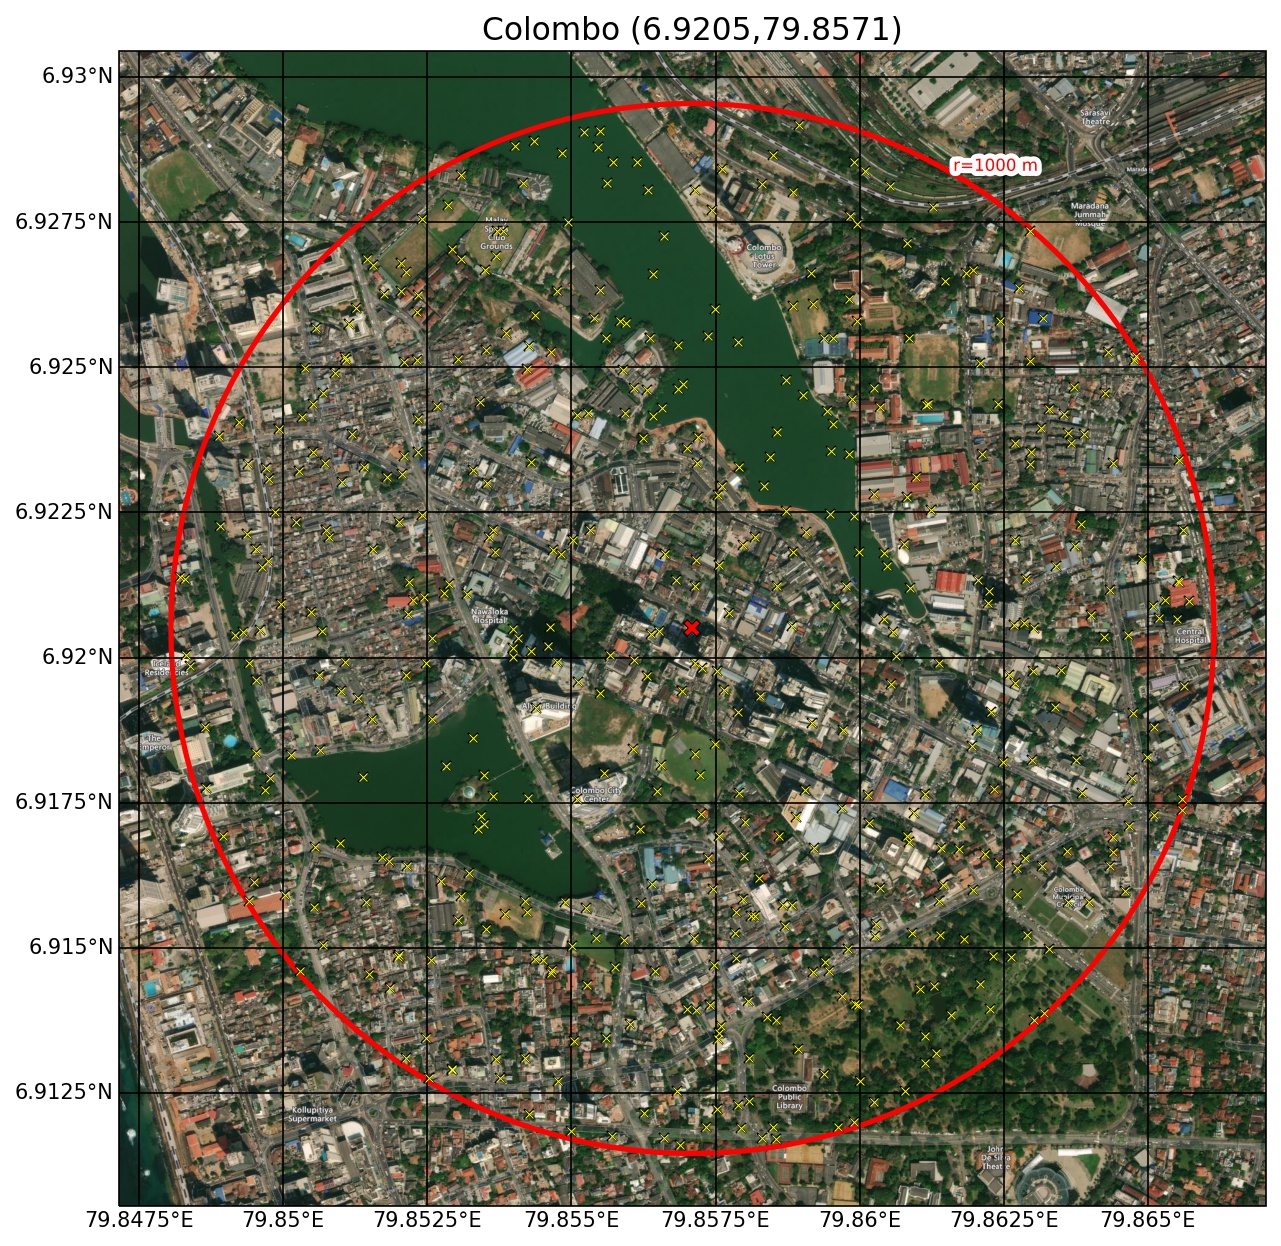
For modelling urban environments I need to know the typical fractions of land use in an area. For this I needed to plot a satellite or map-style image, along with a series of randomly placed markers so I can later count and document the fractions of different areas; buildings, streets, vegetation, water etc.
This turned out to be much more complicated than I first assumed it would be (as seen from the large number of python modules I needed to import). I also borrowed heavily from Joshua Hrisko excellent post on the subject.
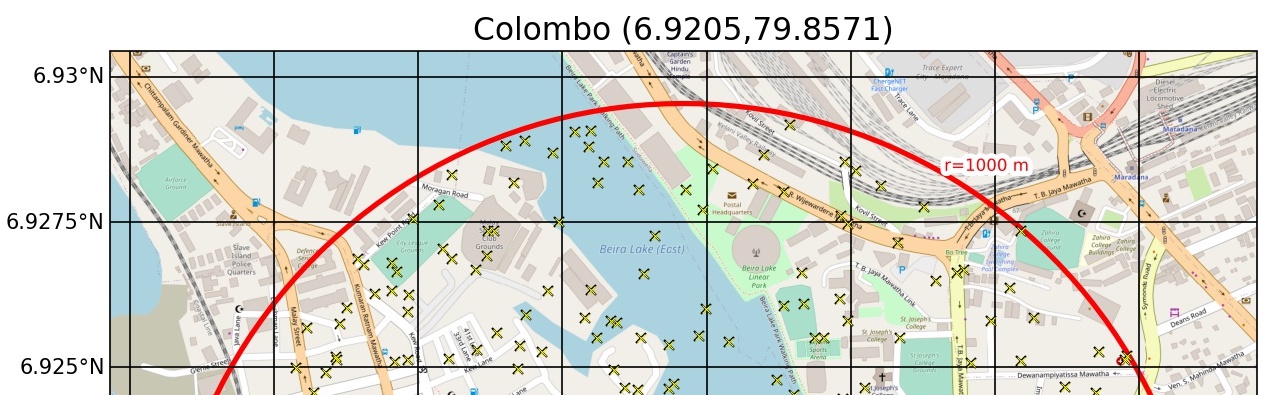
But I now have code which will take in any latitude and longitude and produce either satellite or map-style plots as shown below.
 |
 |
Images available under the Open Database Licence © OpenStreetMap contributors 2021
Inputs
The function requires a latitude, longitude and title. Styles, sizes and points are optional inputs.
The circle radius shown here is 1000 m, and always a geodesic distance from the centre point.
The points are randomly and uniformly distributed within the circle, and their locations are reproducable through seeding the random call with a standard integer.
Finally, the scale of the images imported from OpenStreetMap are automatically adapted based on the radius of the circle input, or can be manually chosed integers (1-19).
Code
The Python code to create these plots is shown below.
__title__   = 'Plot OpenStreetMap site map'
__version__ = 'v1.0 (2021-03-02)'
__author__  = 'Mathew Lipson'
__email__   = 'm.lipson@unsw.edu.au'

import os
import numpy as np
import matplotlib.pyplot as plt
import matplotlib.patches as patches
import matplotlib.patheffects as pe
import cartopy
import cartopy.geodesic as cgeo
import cartopy.crs as ccrs

import cartopy.io.img_tiles as cimgt
import io
from urllib.request import urlopen, Request
from PIL import Image
import shapely

projpath = '.'

##########################################################################

def main():

    sitename = 'Colombo'
    lat = 6.9205
    lon = 79.8571

    # style can be 'map' or 'satellite'

    for style in ['map','satellite']:

        osm_image(lon, lat, sitename=sitename,
            style=style, radius=1000, npoints=500)

    return

##########################################################################

def osm_image(lon,lat,sitename='Columbo',style='satellite',radius=500,npoints=500):
    '''This function makes OpenStreetMap satellite or map image with circle and random points.
    Change np.random.seed() number to produce different (reproducable) random patterns of points.
    Also review 'scale' variable'''

    if style=='map':
        ## MAP STYLE
        cimgt.OSM.get_image = image_spoof # reformat web request for street map spoofing
        img = cimgt.OSM() # spoofed, downloaded street map
    elif style =='satellite':
        # SATELLITE STYLE
        cimgt.QuadtreeTiles.get_image = image_spoof # reformat web request for street map spoofing
        img = cimgt.QuadtreeTiles() # spoofed, downloaded street map
    else:
        print('no valid style')

    stroke = [pe.Stroke(linewidth=1, foreground='w'), pe.Normal()]

    ############################################################################

    plt.close('all')
    fig = plt.figure(figsize=(10,10)) # open matplotlib figure
    ax = plt.axes(projection=img.crs) # project using coordinate reference system (CRS) of street map
    data_crs = ccrs.PlateCarree()

    ax.set_title(f'{sitename} ({lat},{lon})',fontsize=15)

    # auto-calculate scale
    scale = int(120/np.log(radius))
    scale = (scale<20) and scale or 19

    # or change scale manually
    # NOTE: scale specifications should be selected based on radius
    # but be careful not have both large scale (>16) and large radius (>1000),
    #  it is forbidden under [OSM policies](https://operations.osmfoundation.org/policies/tiles/)
    # -- 2     = coarse image, select for worldwide or continental scales
    # -- 4-6   = medium coarseness, select for countries and larger states
    # -- 6-10  = medium fineness, select for smaller states, regions, and cities
    # -- 10-12 = fine image, select for city boundaries and zip codes
    # -- 14+   = extremely fine image, select for roads, blocks, buildings

    extent = calc_extent(lon,lat,radius*1.1)
    ax.set_extent(extent) # set extents
    ax.add_image(img, int(scale)) # add OSM with zoom specification

    # add site
    ax.plot(lon,lat, color='black', marker='x', ms=7, mew=3, transform=data_crs)
    ax.plot(lon,lat, color='red', marker='x', ms=6, mew=2, transform=data_crs)

    if npoints>0:
        # set random azimuth angles (seed for reproducablity)
        np.random.seed(1235)
        rand_azimuths_deg = np.random.random(npoints)*360

        # set random distances (seed for reproducablity)
        np.random.seed(6341)
        rand_distances = radius*np.sqrt((np.random.random(npoints))) # np.random.uniform(low=0, high=radius, size=npoints)

        rand_lon = cgeo.Geodesic().direct((lon,lat),rand_azimuths_deg,rand_distances)[:,0]
        rand_lat = cgeo.Geodesic().direct((lon,lat),rand_azimuths_deg,rand_distances)[:,1]

        ax.plot(rand_lon,rand_lat,color='black',lw=0,marker='x',ms=4.5,mew=1.0,transform=data_crs)
        ax.plot(rand_lon,rand_lat,color='yellow',lw=0,marker='x',ms=4,mew=0.5,transform=data_crs)

    # add cartopy geodesic circle
    circle_points = cgeo.Geodesic().circle(lon=lon, lat=lat, radius=radius)
    geom = shapely.geometry.Polygon(circle_points)
    ax.add_geometries((geom,), crs=ccrs.PlateCarree(), edgecolor='red', facecolor='none', linewidth=2.5)

    radius_text = cgeo.Geodesic().direct(points=(lon,lat),azimuths=30,distances=radius)[:,0:2][0]
    stroke = [pe.Stroke(linewidth=5, foreground='w'), pe.Normal()]
    ax.text(radius_text[0],radius_text[1],f'r={radius} m', color='red',
        fontsize=8, ha='left',va='bottom', path_effects=stroke, transform=data_crs)

    gl = ax.gridlines(draw_labels=True, crs=data_crs,
                        color='k',lw=0.5)

    gl.top_labels = False
    gl.right_labels = False
    gl.xformatter = cartopy.mpl.gridliner.LONGITUDE_FORMATTER
    gl.yformatter = cartopy.mpl.gridliner.LATITUDE_FORMATTER

    # plt.show()

    fig.savefig(f'{projpath}/{sitename}_{style}_r{radius}_pts{npoints}_scale{scale}.jpg', dpi=150, bbox_inches='tight')

    return

def calc_extent(lon,lat,dist):
    '''This function calculates extent of map
    Inputs:
        lat,lon: location in degrees
        dist: dist to edge from centre
    '''

    dist_cnr = np.sqrt(2*dist**2)
    top_left = cgeo.Geodesic().direct(points=(lon,lat),azimuths=-45,distances=dist_cnr)[:,0:2][0]
    bot_right = cgeo.Geodesic().direct(points=(lon,lat),azimuths=135,distances=dist_cnr)[:,0:2][0]

    extent = [top_left[0], bot_right[0], bot_right[1], top_left[1]]

    return extent

def image_spoof(self, tile):
    '''this function reformats web requests from OSM for cartopy
    Heavily based on code by Joshua Hrisko at:
        https://makersportal.com/blog/2020/4/24/geographic-visualizations-in-python-with-cartopy'''

    url = self._image_url(tile)                # get the url of the street map API
    req = Request(url)                         # start request
    req.add_header('User-agent','Anaconda 3')  # add user agent to request
    fh = urlopen(req)
    im_data = io.BytesIO(fh.read())            # get image
    fh.close()                                 # close url
    img = Image.open(im_data)                  # open image with PIL
    img = img.convert(self.desired_tile_form)  # set image format
    return img, self.tileextent(tile), 'lower' # reformat for cartopy

if __name__ == "__main__":

   main()