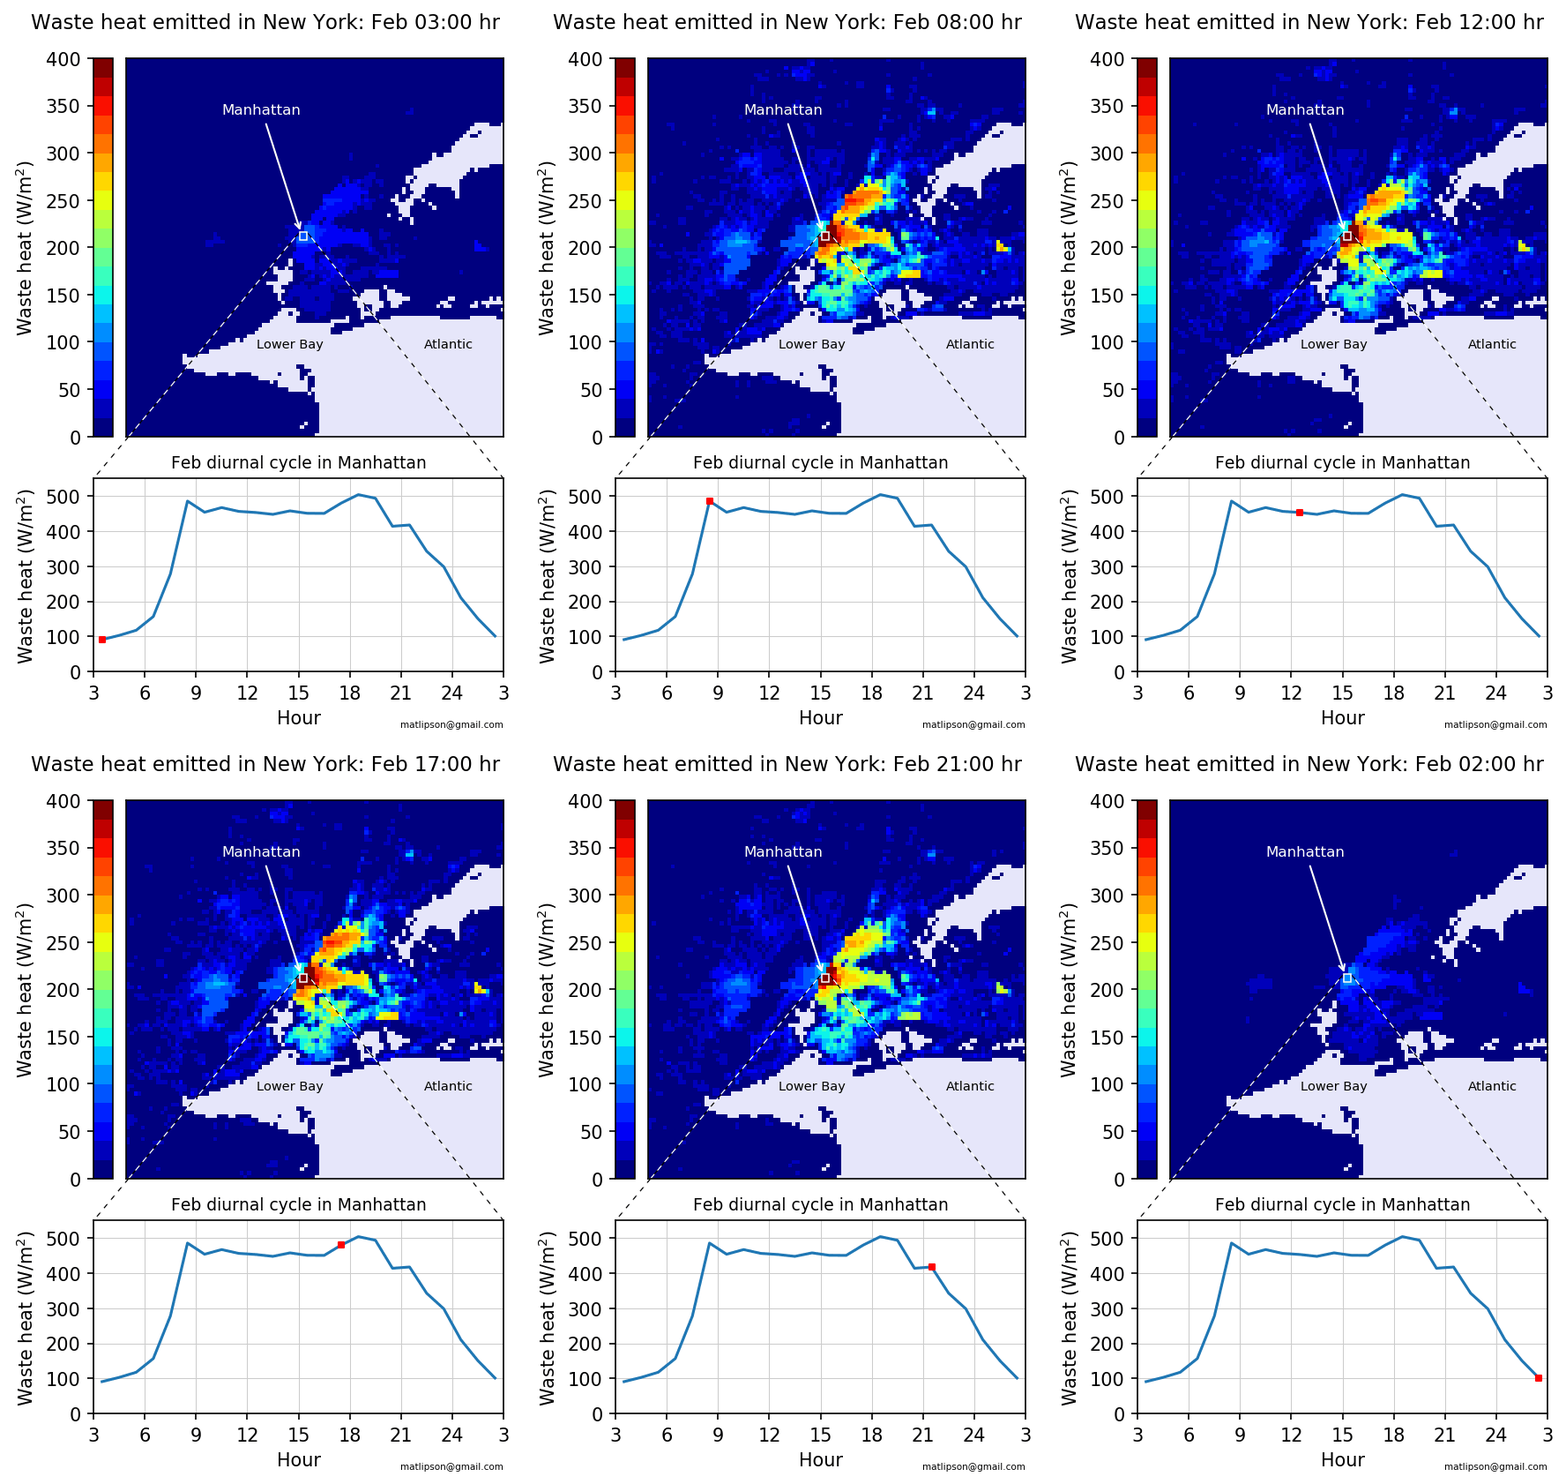
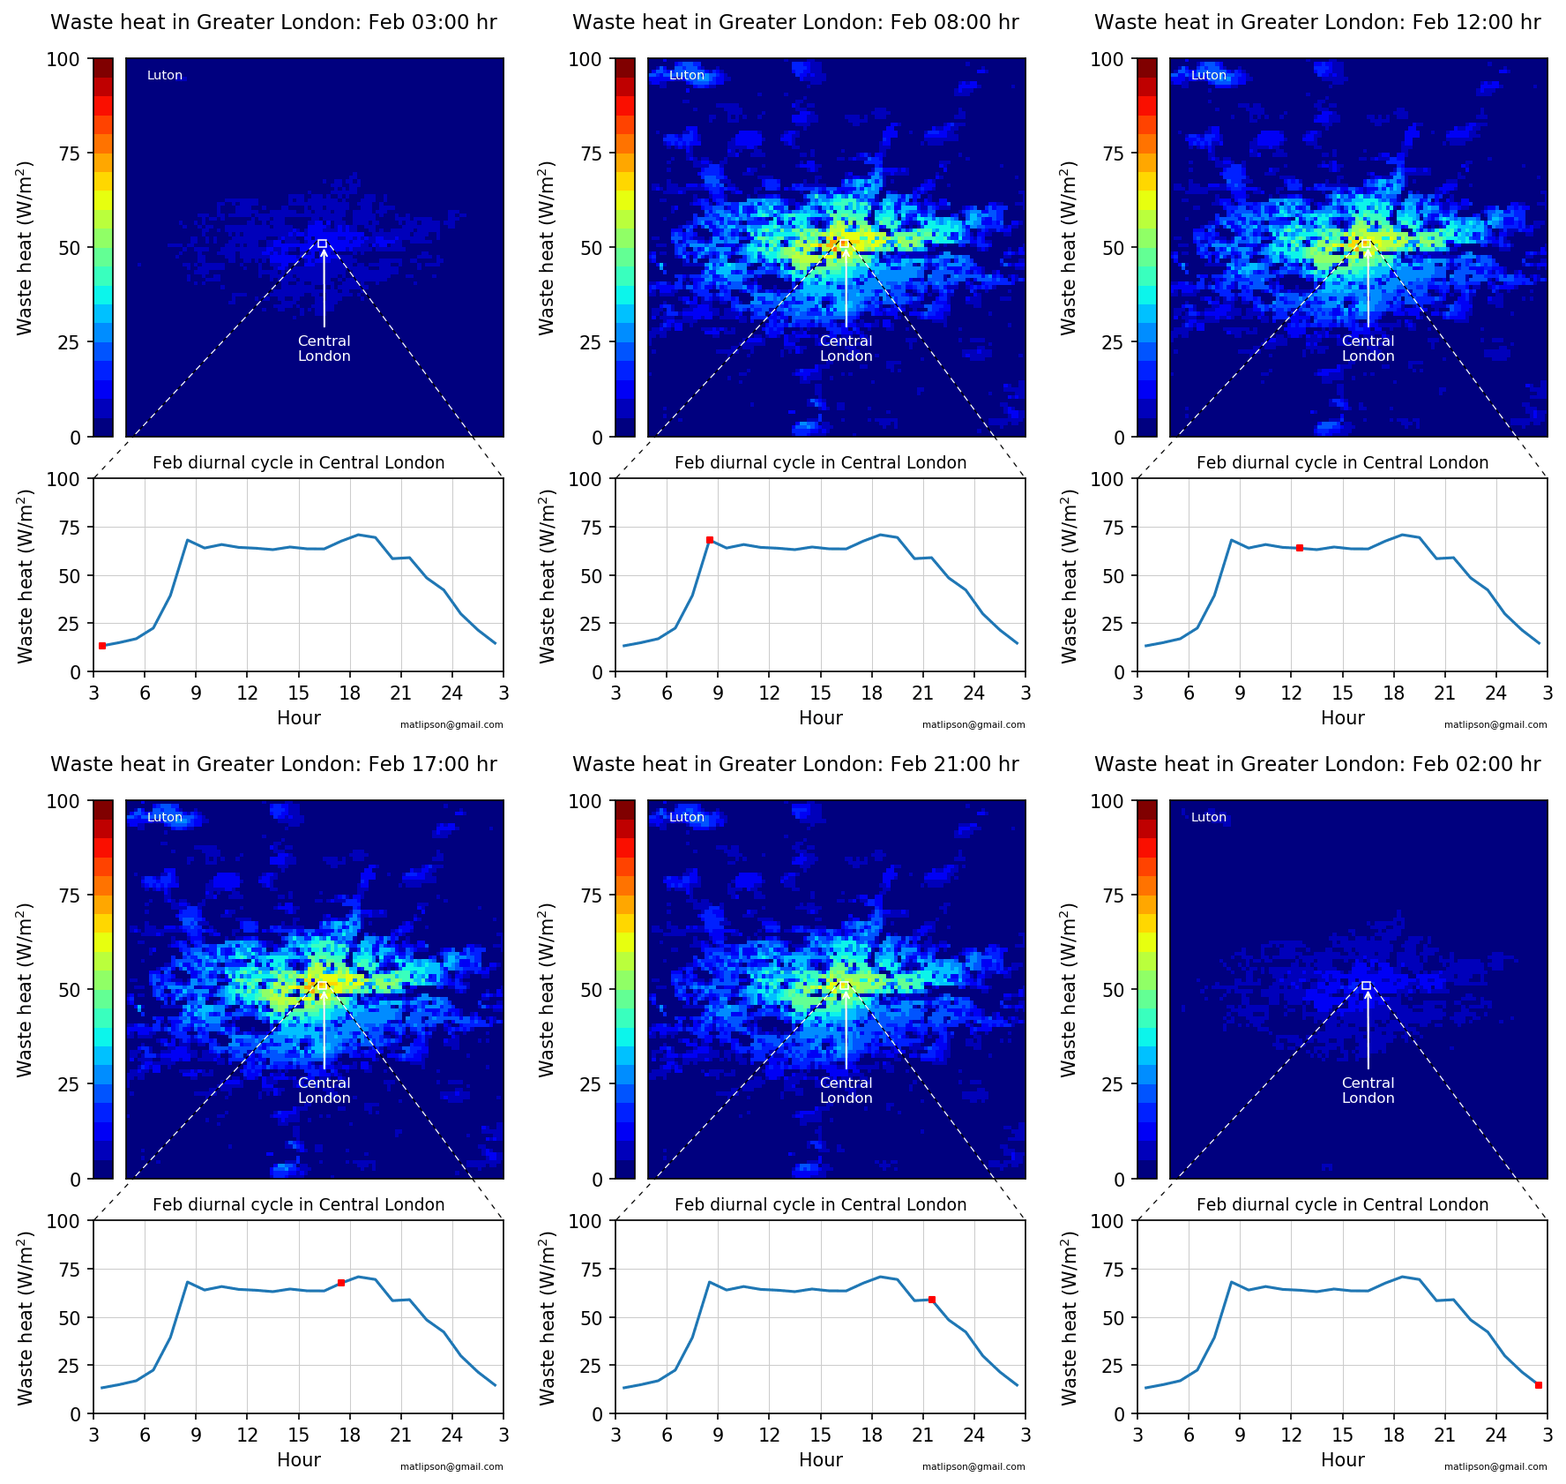
This extends a previous post on anthropogenic waste heat to include plots for New York and London.
We are rolling towards the inevitable heat death of the universe. While that might be an over dramatic opening to a post about waste heat in cities, it is kinda related. The second law of thermodynamics says total entropy in a system must increase, or more simply, all energy ends up as waste heat. While the final fate if the universe is still uncertain, conversion to waste heat is at least true for energy we consume in cities. Whether that’s the electricity used to power modern appliances and air conditioning, or gas used to heat homes, or petrol used to fuel the transport sector, it nearly all ends up as heat emitted into the atmosphere.
I previously plotted the waste heat estimated to be generated in Melbourne, a city with relatively low densities of buildings and people, and therefore low waste heat intensity (although with impacts still measurable). Here I’m plotting two denser cities: New York and London. The data is taken from a global dataset described in Dong et al. (2017), and estimates average values of waste heat emitted at each hour of the day in different seasons in 30 arc-seconds blocks. As the length of an arc-second in the East/West direction depends on latitude the maps will look a little stretched.


Note the scales for waste heat in New York and London are different, and New York is estimated to be using five times the energy of London. Also note the geography of New York plays a greater roll in determining where energy is used. In Manhattan waste heat is estimated to routinely reach 500 W m2. This is more energy than is received from the sun on a typical NY winters day. Even at lower intensities, waste heat can raise air local temperatures and change air flow through buoyancy driven processes, affecting air pollution and atmospheric stability.
The values in this dataset are estimated by summing the total energy used by a country and dividing spatially based on population densities and other factors, like how much light is emitted in night-time satellite photos. As such, actual values are likely to vary over different regions, and from day to day depending on the weather. Even with the inherent uncertainties, it’s clear that waste heat can play a big role in determining local climate within cities.
If you want to see the code used to plot these animations, see my post here
